
Bitcoin, which experienced a 42% correction after November, continues to trade above $41,000.

We see that the price started to decrease before the sharp rises expected due to many negative news flows.

With the effect of this, we see that in the in-chain data section, the price cannot overheat and cool down. In fact, although this chart is an indicator of price maturation, investors want to see more green colours.
Analyst Will Clemente, who studies on-chain data, shared an indicator that examines dormant Bitcoin flows and said, “We have entered the buy zone.”

Reminding that this bottom signal has come only 5 times in the history of Bitcoin, the analyst also shared a chart.
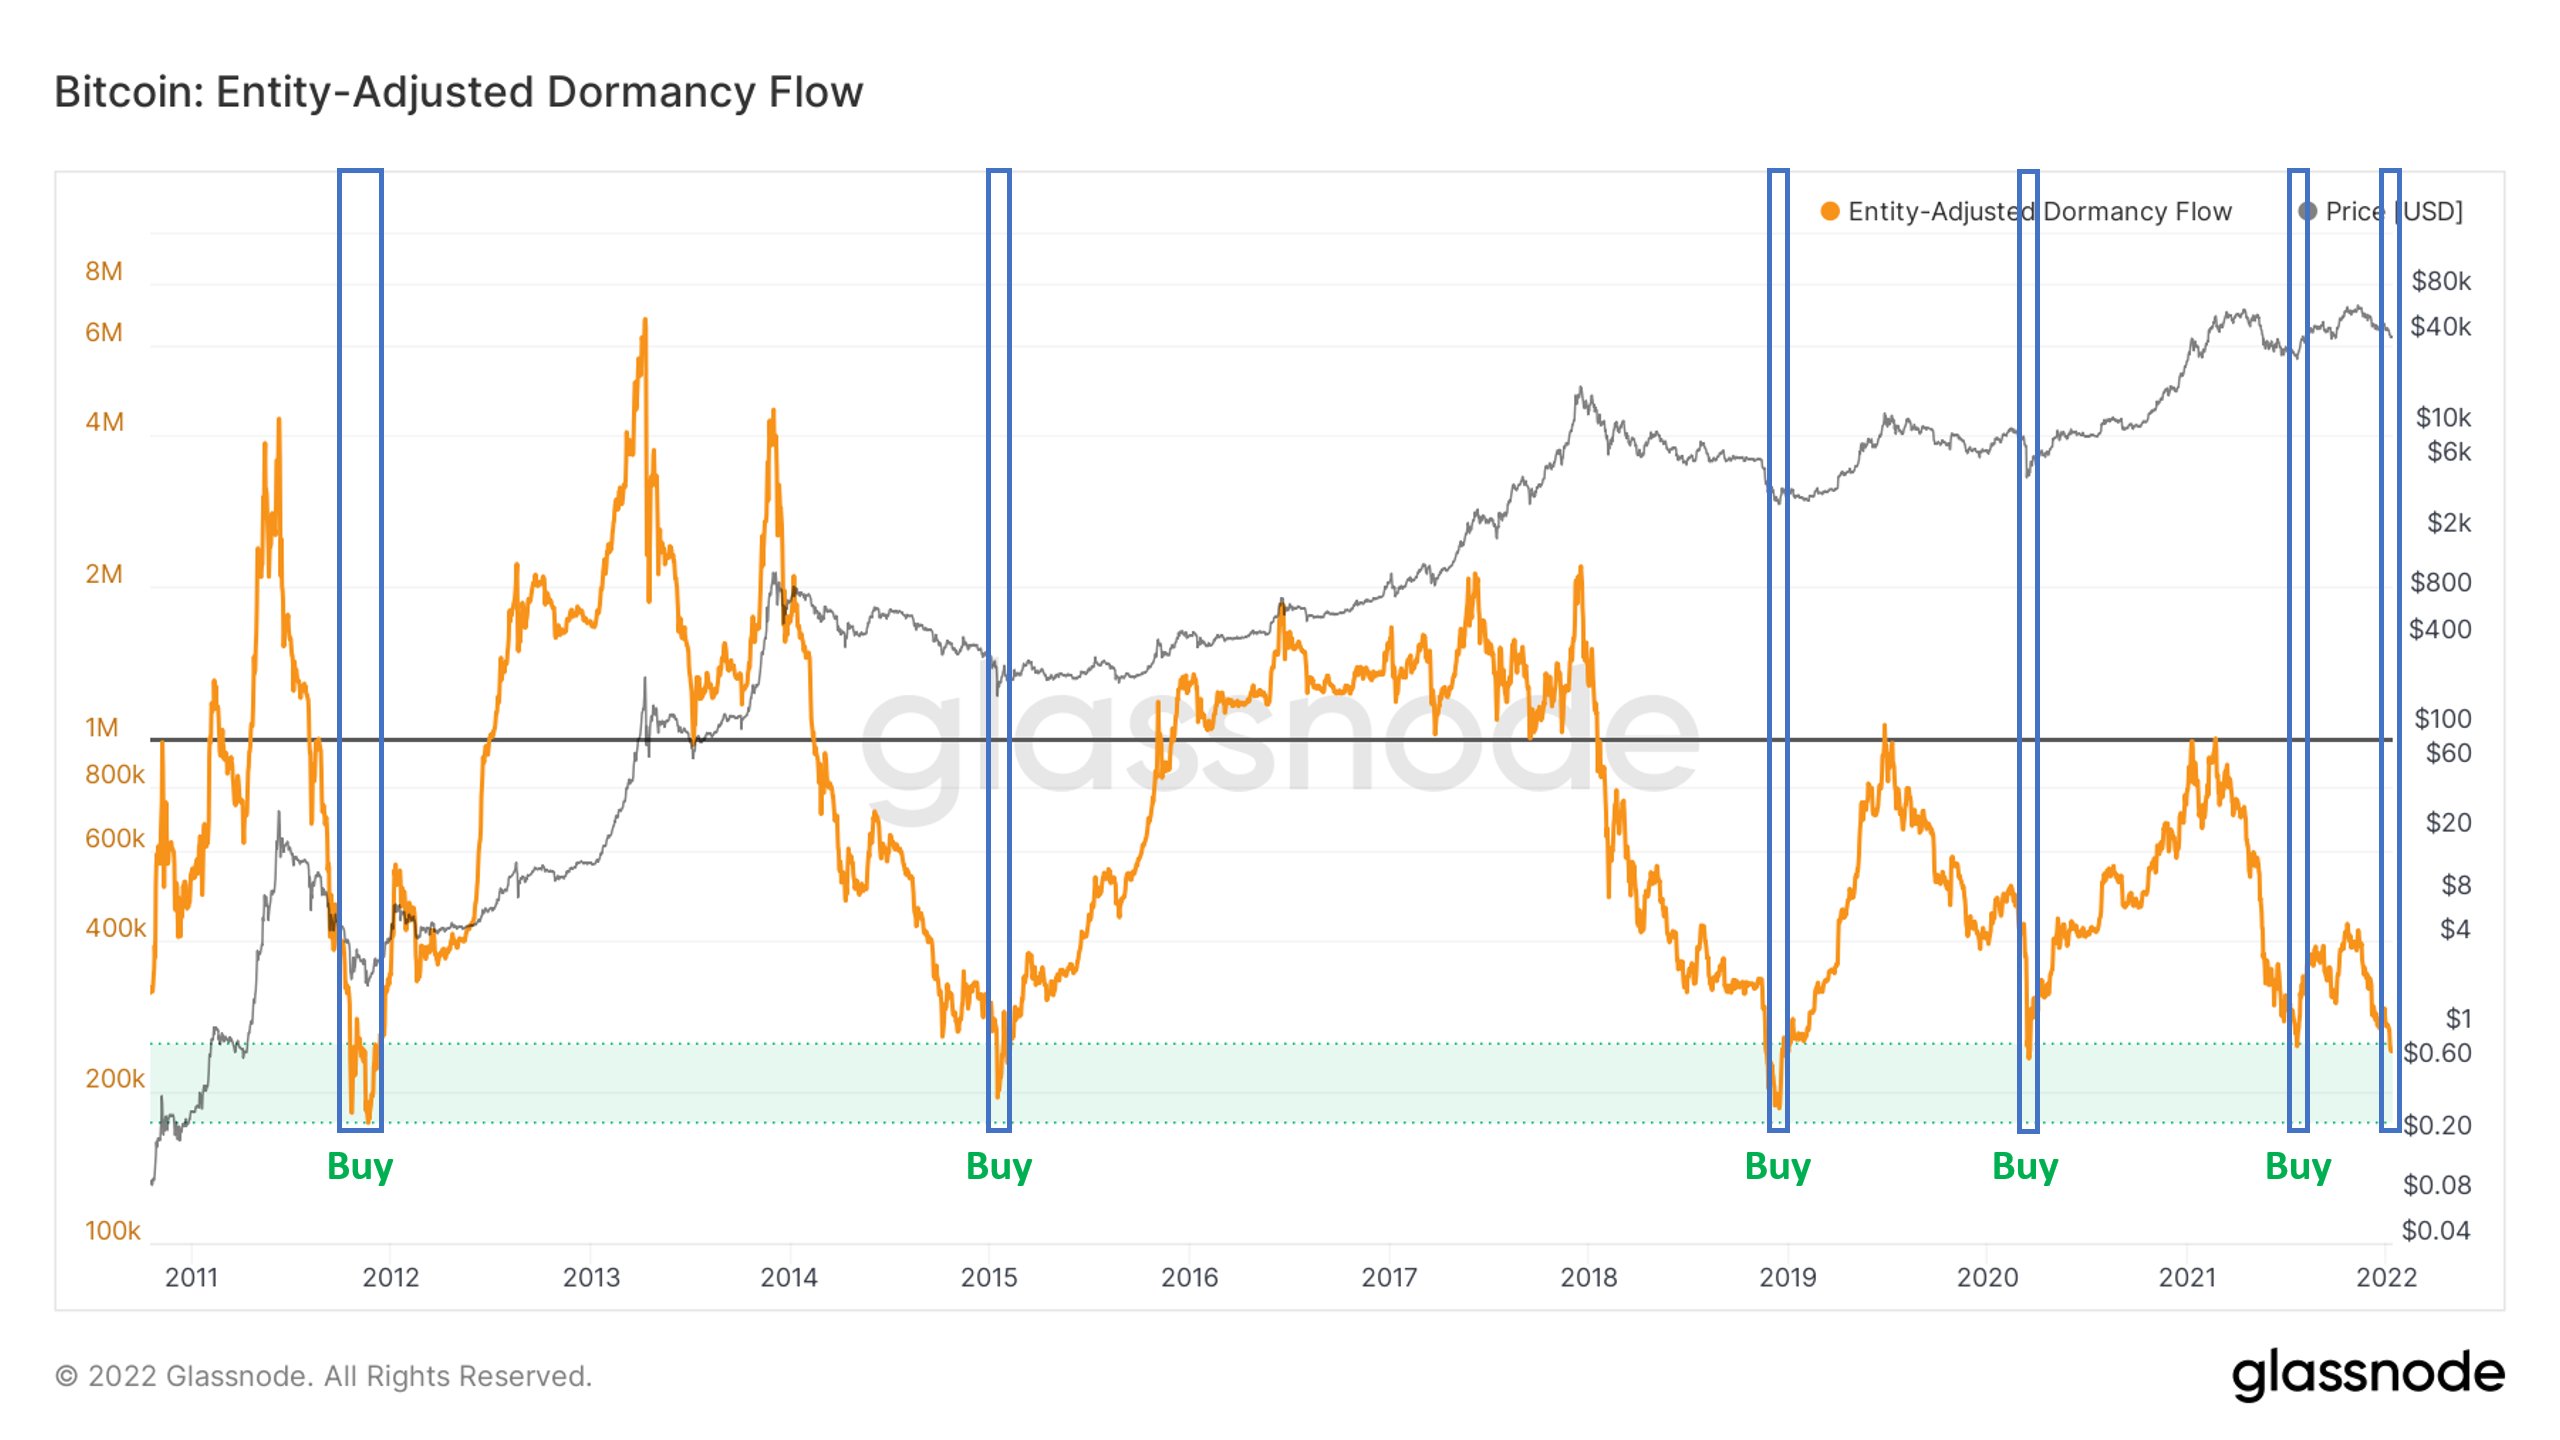
What is Entity-Adjusted Dormancy Flow?
It is the ratio of current market value to annual dormancy value (measured in US dollars). The asset-adjusted Dormancy Flow can be used to time the lows of the market and assess whether the bull market remains relatively normal. It helps you confirm whether Bitcoin is in an uptrend or a downtrend.
*Not Investment Advice.