
Litecoin (LTC) price has declined since reaching a yearly high of $115 in July.
The price also broke the short-term ascending support trend line. Will it hold $60 next or fall?
Litecoin Drops After Deviation
Weekly timeframe technical analysis for LTC shows that the price broke out of the 770-day descending resistance trend line in June, reaching a new yearly high of $116.
This seems to have caused a break between the trend line and the $105 resistance area.
However, cryptocurrency The unit could not sustain its increase. Conversely, it climbed above the $105 resistance (red circle). Then it fell sharply below.
LTC price fell below the long-term trend line in August. It is currently trading slightly above the $60 horizontal support area.
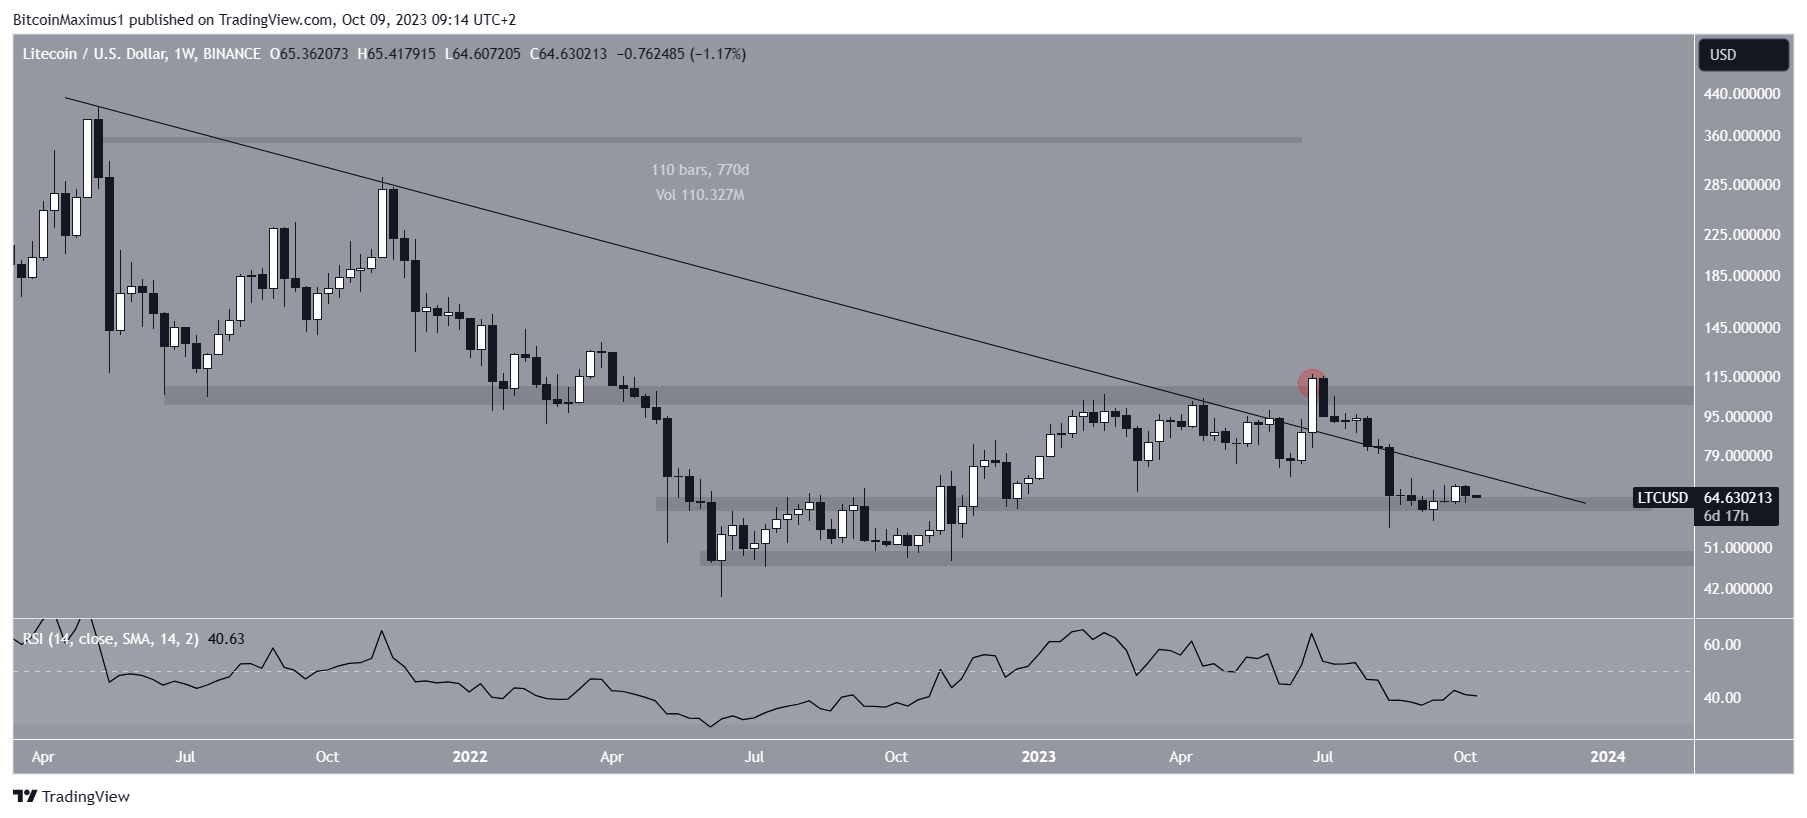
The weekly RSI gives a bearish reading. With the RSI as a momentum indicator, investors can determine whether a market is overbought or oversold. Moreover, he can decide whether to accumulate or sell an asset.
If the RSI value is above 50 and the trend is upward, the bulls have an advantage. However, if the value is below 50, the opposite is true. The RSI is below 50 (red icon) and falling, both signs of a bearish trend.
Litecoin Price Prediction: What Will Happen Next?
Daily timeframe readings are mixed and trending slightly downward.
The main reason for the downtrend is price action. LTC broke down from an ascending support trend line on October 4. This shows that the previous upward movement has been completed. The rest of the crypto market saw a similar decline.
The reaction to the minor $68 resistance area is also bearish. altcoin It broke above this in August and then failed to break twice before falling below the ascending support trend line.
While Litecoin price action is bearish, the RSI still gives hope for a reversal of the bullish trend. This is because the bullish divergence trendline (green line) that preceded the increase is still intact.
A bullish divergence occurs when a price decline is accompanied by an increase in momentum. It usually leads to a trend reversal.
In any case, the diverging trendline cannot eliminate the downward price movement. If the decline continues, LTC could drop another 9% and reach minor support at $58.
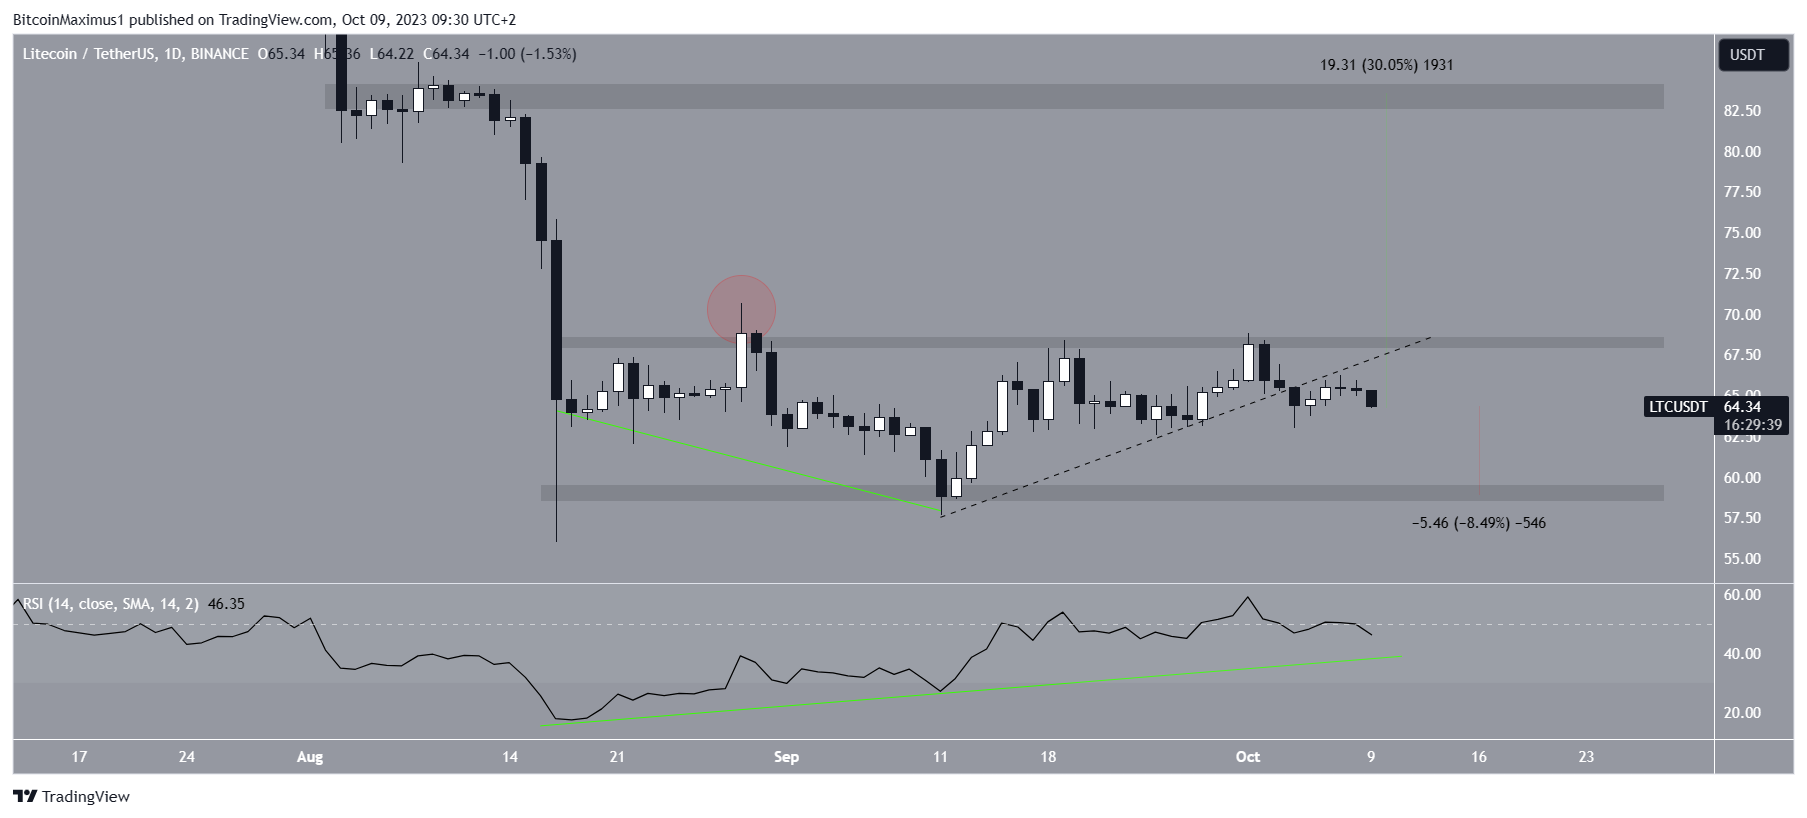
Despite this bearish LTC price prediction, a recovery of the ascending support trend line and the $68 area would mean that the trend is on the rise.
In this case, a 30% increase may occur towards the next resistance point at $83.