
On February 24, Uniswap (UNI) price reached a two-year high of $12.85. However, it has decreased slightly since then. UNI’s rise occurred by breaking through long-term horizontal and diagonal resistance levels.
Uniswap Breaks Above Resistance
UNI’s weekly timeframe technical analysis shows that it has been bullish in a long-term horizontal support area since October 2023. The upward move resulted in a breakout from the declining resistance trend line the following month. During this period, the trend line existed for 480 days.
After several retests, UNI’s price made another upward move at the beginning of 2024 and broke out of a horizontal resistance area. The increase reached a high of $12.86 last week. Afterwards, the UNI price experienced a slight decline.
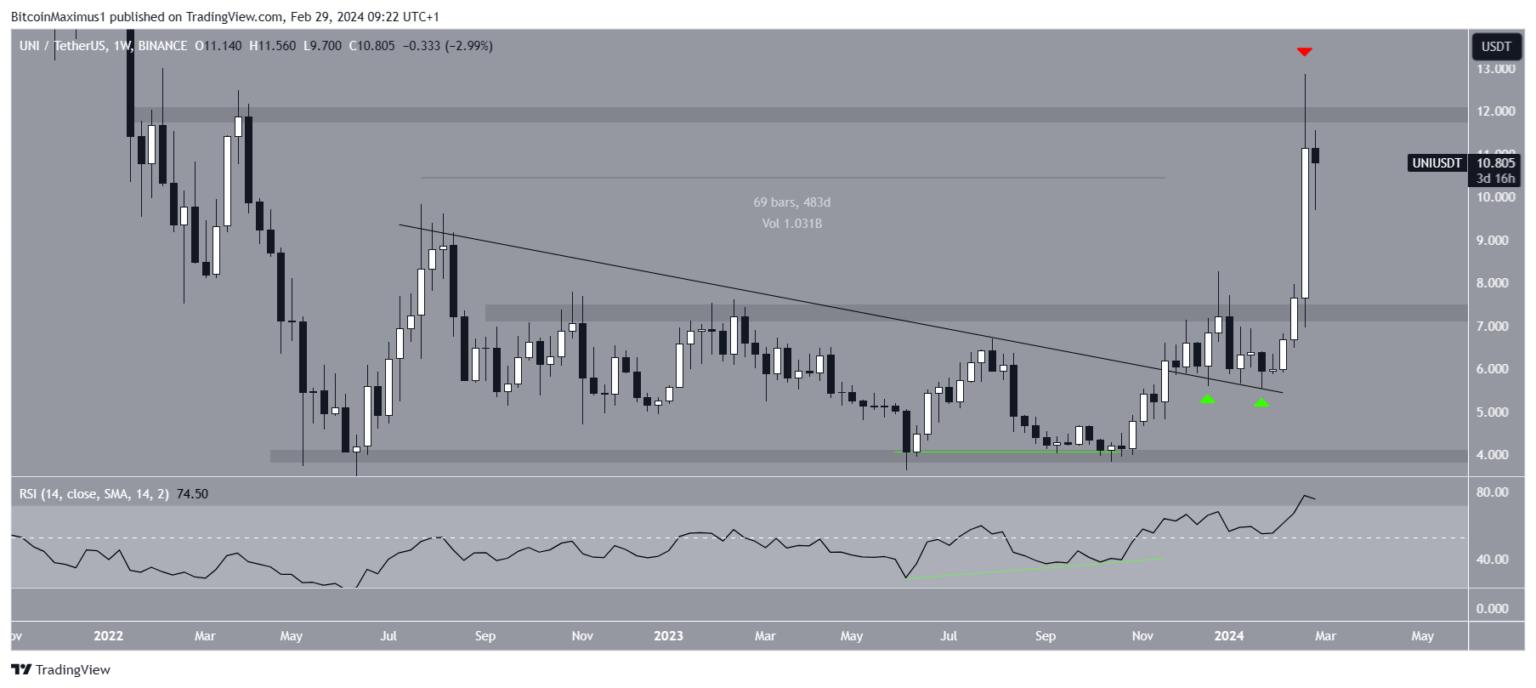
The weekly Relative Strength Index (RSI) supports the upward trend. Market traders use the RSI as a momentum indicator to identify overbought or oversold conditions and decide whether to accumulate or sell an asset. Readings above 50 and a bullish reversal indicate that the bulls still have the advantage. On the other hand, readings below 50 indicate the opposite.
First, a bullish divergence was observed on the RSI (green trend line) before the upward move. Since then, the upward trend in the RSI has been continuing and it just broke above 70. There is no downward divergence that would negate the previous upward movement.
UNI Price Forecast: Where Will the Breakout Reach?
The technical analysis of the daily time frame shows an upward trend in the same direction as the weekly analysis. This is due to wavenumber and RSI readings.
The most likely wave count predicts that UNI’s upward move will continue. Technical analysts use Elliott Wave Theory to determine the direction of the trend. They examine recurring long-term price patterns and investor psychology.
The wave count predicts that UNI is in the third wave of a five-wave uptrend (white). The lower wave count is given in black, showing that UNI is in the fourth subwave.
If the count is correct, UNI price will begin another upward move after the current correction is completed. This could take UNI price to the next resistance at $16.10, giving a 1:1.61 ratio to the first and third waves. This would be a 50% upward move.
The daily RSI supports this possibility as the indicator is rising and is above 70.
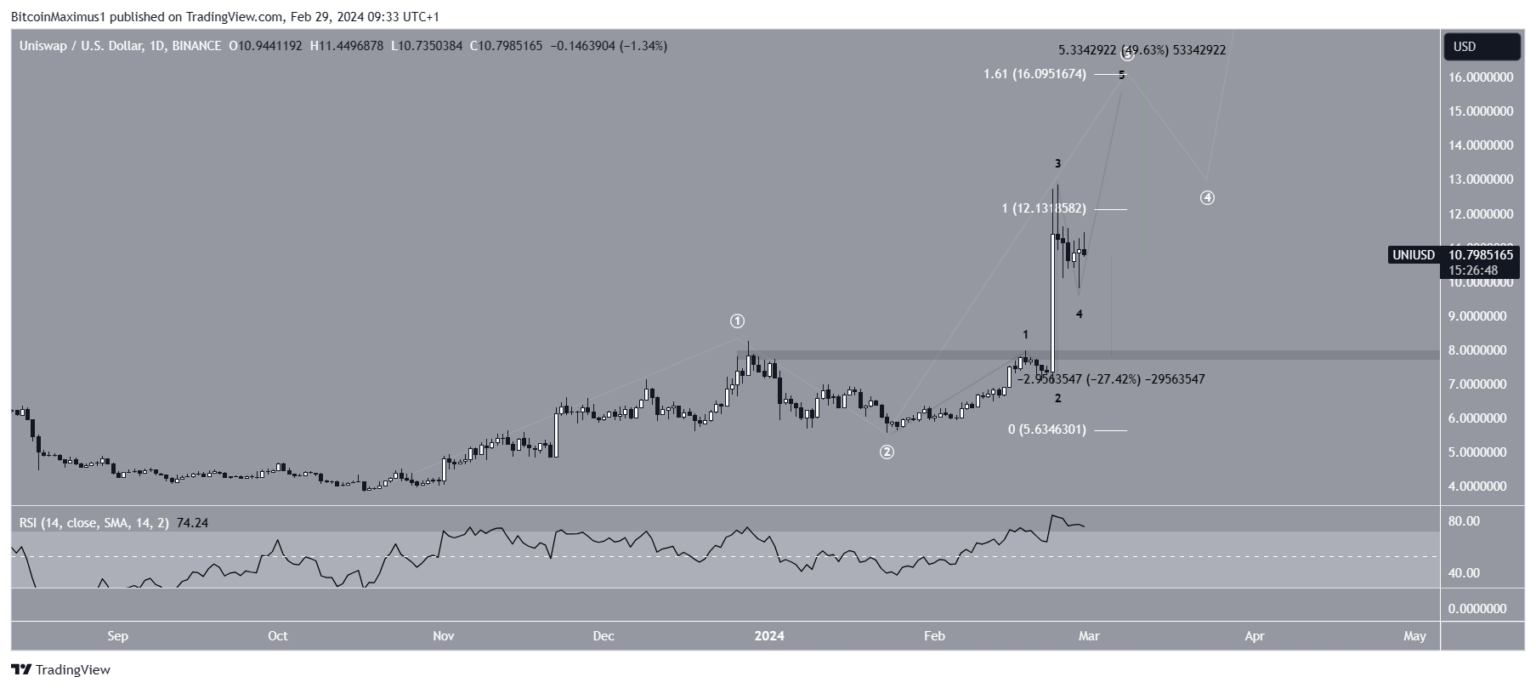
Although UNI’s price forecast is bullish, a failure to break out of the $12.10 highs could trigger a near 30% decline to the nearest support level at $7.80.
