
According to crypto analyst Rakesh Upadhyay, Bitcoin is stuck in an ascending triangle formation. However, UNI, NEAR, OP and INJ are promising in the short term. Can Bitcoin and these altcoins continue their upward trend in the first week of the new year? The analyst examines the charts of Bitcoin and the 4 most promising tokens.
Bitcoin (BTC) price analysis
The bears attempted to push Bitcoin below the support line of the ascending triangle formation on December 29 and 30. However, the bulls held their ground. The flat 20-day exponential moving average ($42,484) and the relative strength index (RSI) near the midpoint suggest a balance between buyers and sellers. If the price breaks above the 20-day EMA, the bulls will attempt to push BTC above $44,700. Thus, they will attempt to complete the bullish setup. If they succeed, it is possible for BTC to continue its uptrend towards the pattern target of $49,178.
Conversely, if the price turns down and falls below the triangle, the bullish formation will be invalidated. Breaking a positive pattern is a negative sign as it will trigger stops from aggressive traders. In this case, it is possible that BTC will first drop to $40,000 and eventually to $37,980.
Altcoin Uniswap (UNI) price analysis
The altcoin is witnessing a tough battle between the bulls and bears near the overhead resistance at $7.79. Upward sloping moving averages and the RSI near 66 indicate that the path of least resistance is to the upside. If buyers break the hurdle at $7.79, it is possible that UNI will gain momentum to $8.26 and then to $9.65.
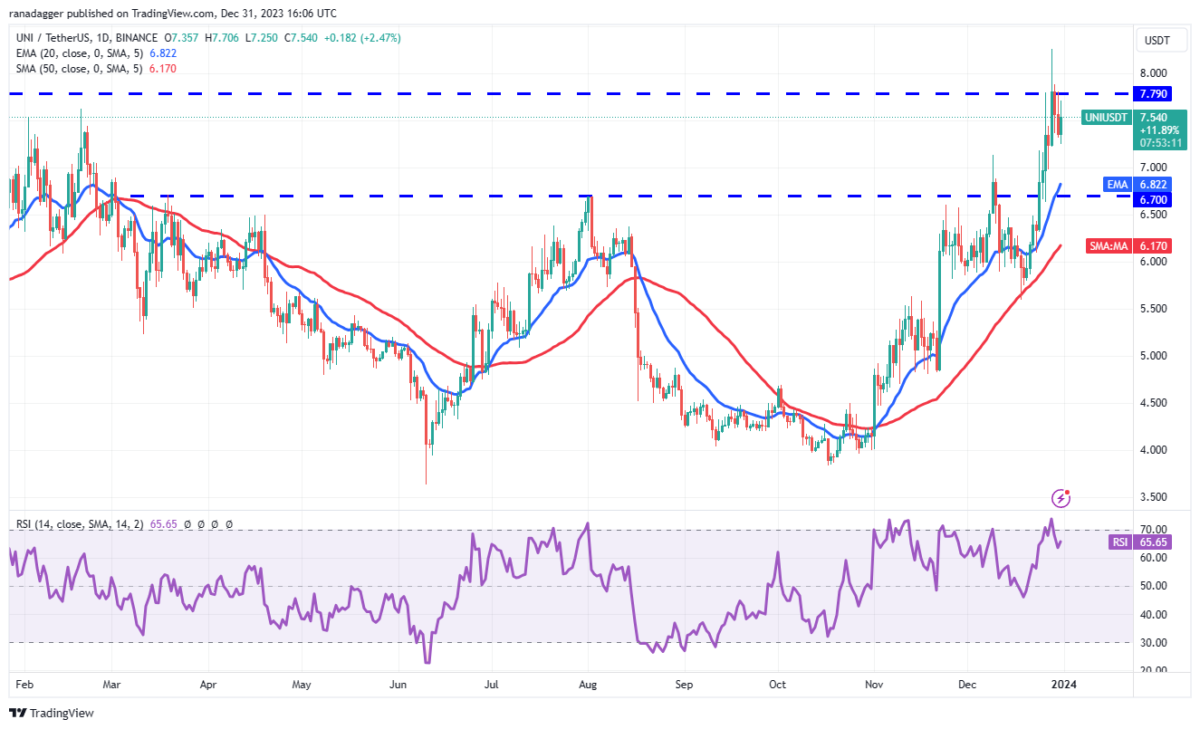
Contrary to this assumption, if the price turns down from $7.79, it would indicate that the bears are fiercely defending the level. In this case, UNI is likely to fall to the important support at $6.70, which is likely to attract buyers’ interest.
Altcoin Near Protocol (NEAR) price analysis
The altcoin price is trying to find support between the 38.2% Fibonacci retracement level at $3.64 and the 50% Fibonacci retracement level at $3.34. The gradually rising 20-day EMA ($3.30) and the RSI in the positive zone suggest that buyers have a slight advantage. The bulls will try to push the price towards the December 26 high at $4.62. If they exceed this level, it is possible for NEAR to rise up to $6.
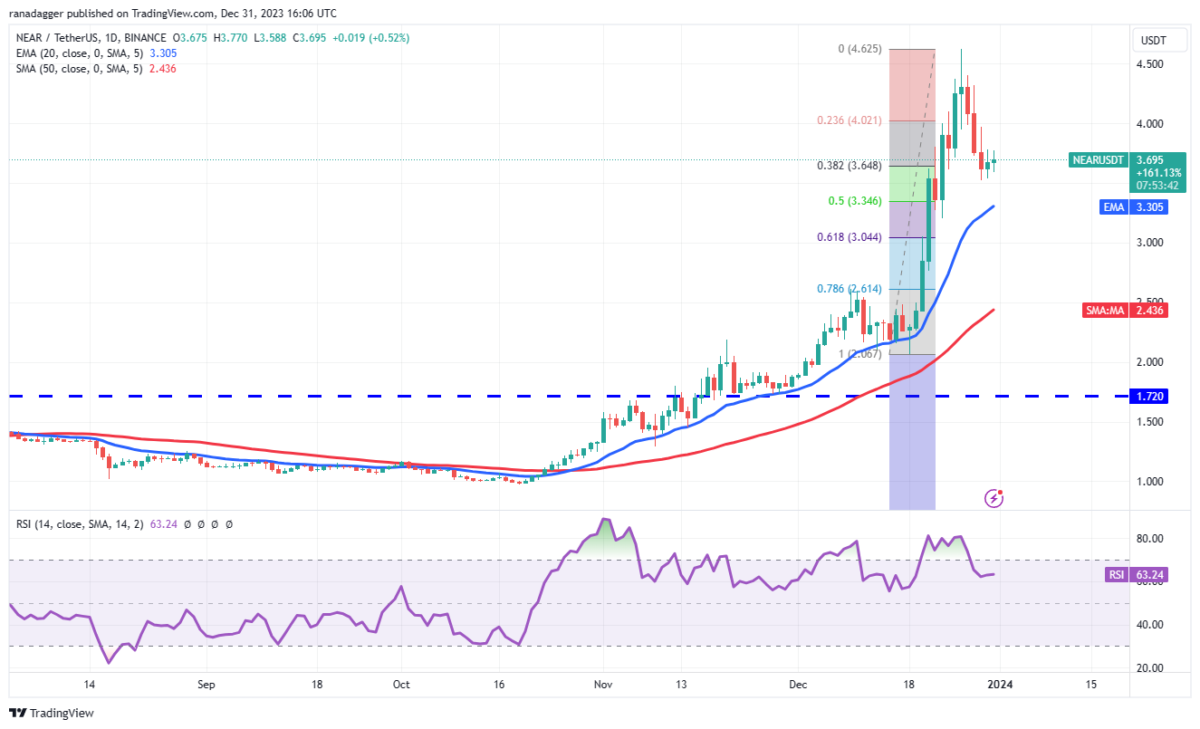
Meanwhile, NEAR bears are likely to have other plans. They will try to sell rallies and push the price below the 20-day EMA. If they do, the decline is likely to extend to the 61.8% Fibonacci retracement level of $3.04 and then to the 50-day SMA ($2.43).
Optimism (OP) price analysis
cryptokoin.comAs you follow from , the altcoin has been consolidating in an upward trend for the last few days. This shows that the bulls are not rushing to exit as they are waiting for another leg up. The rising 20-day EMA ($3.07) and the RSI in the positive zone suggest that the bulls are in command. Buyers are expected to defend the $3.40 to $3.22 support zone strongly. A strong rebound from this support zone would indicate that lower levels continue to attract buyers. It is possible that OP may then rise to $4.18 and then to $5.
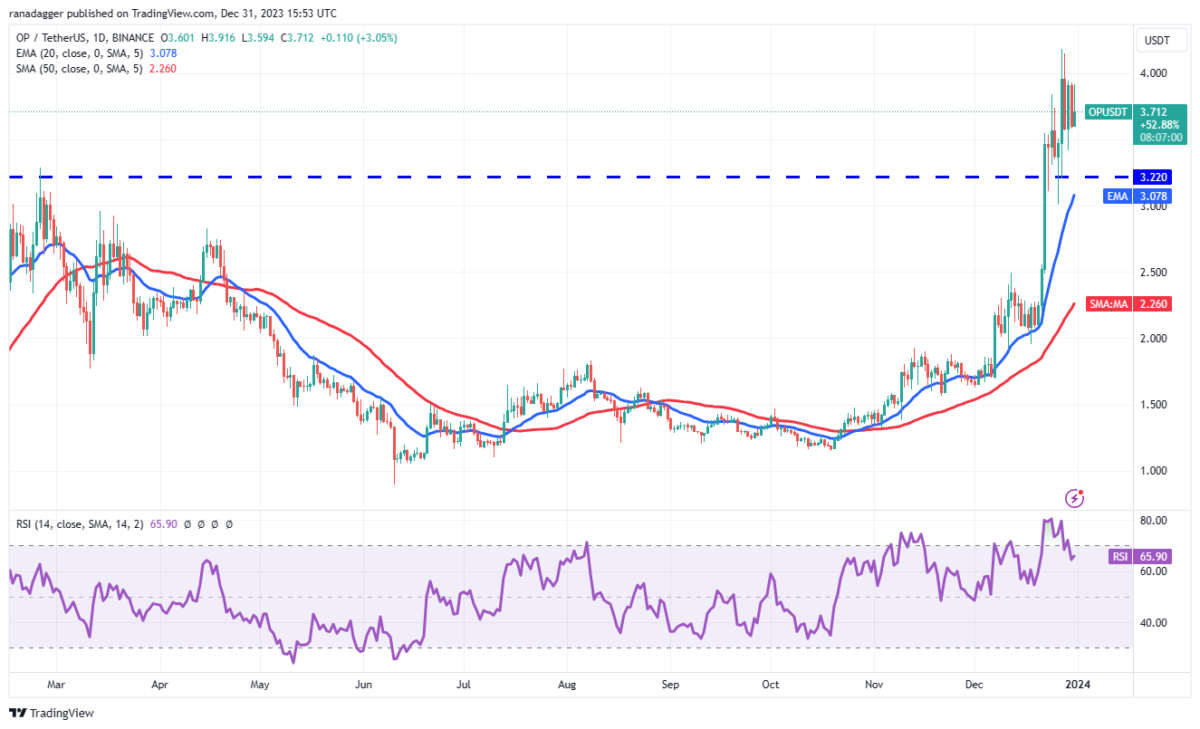
If the bears want to prevent the upside, they will have to sink the price below the $3.22 breakout level. In this case, OP is likely to drop to $2.75 later.
Altcoin Injective (INJ) price analysis
The altcoin price pulled back with support from the 20-day EMA ($34.73) on December 30. This suggests that sentiment for INJ remains positive and traders are buying the dips. A bounce from the 20-day EMA is likely to face resistance at $40. However, if the bulls break this barrier, it is possible that INJ could retest the overhead resistance at $44.86. A break above this level could start the next leg of the uptrend towards $51.

This positive view will be invalidated in the near term if INJ price turns down from overhead resistance and breaks below the 20-day EMA. This is likely to initiate a sharp decline towards the 50-day SMA ($24.69).
To be informed about the latest developments, follow us twitter‘in, Facebookin and InstagramFollow on and Telegram And YouTube Join our channel!