
Despite Bitcoin’s decline since January 14, these 3 altcoins have shown positive price movement. According to crypto analyst Valdrin Tahiri, these three altcoins exhibit bullish formations against Bitcoin. Therefore, it is possible that they will outperform Bitcoin in February.
LINK price prediction: Altcoin broke long-term resistance
Weekly time frame technical analysis shows that LINK price has been falling below a descending resistance trend line since June 2020. The decline led to a low of ₿0.00018 in June 2023. The move seemingly caused a breakout from the $0.00023 support area. However, LINK took it back shortly after. Additionally, it turned the decline into a divergence (red circle). The altcoin price broke out of the trend line after more than 1,100 days. It also reached a high of ₿0.00045 in November before falling. The subsequent decline confirmed the ₿0.00042 area as resistance.
Despite the decline, LINK is back on its feet and attempting another breakout. If successful, the price is possible to rise to the next resistance at ₿0.00075. This means a 100% increase. Meanwhile, the daily Relative Strength Index (RSI) supports the upward move. Traders use the RSI as a momentum indicator to evaluate whether a market is overbought and oversold and whether an asset should be accumulated or sold. If the RSI value is above 50 and the trend is upward, the bulls still have the advantage. However, if the value is below 50, the opposite is true. The RSI for LINK is above 50 and rising. Both are bullish signs for the altcoin.
Despite this bullish LINK price prediction, failure to break above the ₿0.00042 level could trigger a 40% decline to the nearest support at ₿0.00022.
FXS price prediction: Completing accumulation
Frax Share (FXS) price had fallen below a descending resistance trend line since the all-time high price of ₿0.0012 at the beginning of 2022. The trend line was confirmed several times and fell as low as ₿0.00013 in November 2023. The price has increased since then. Moreover, it broke out of the trend line two weeks ago. At that time, the trend line had been in place for approximately 730 days. Before the breakout, the weekly RSI formed a bullish divergence for more than six months. Such a divergence is rare and usually leads to a reversal of the uptrend. If FXS continues to rise, it is possible for the altcoin to reach resistance at ₿0.00048, which is 100% above its current price.
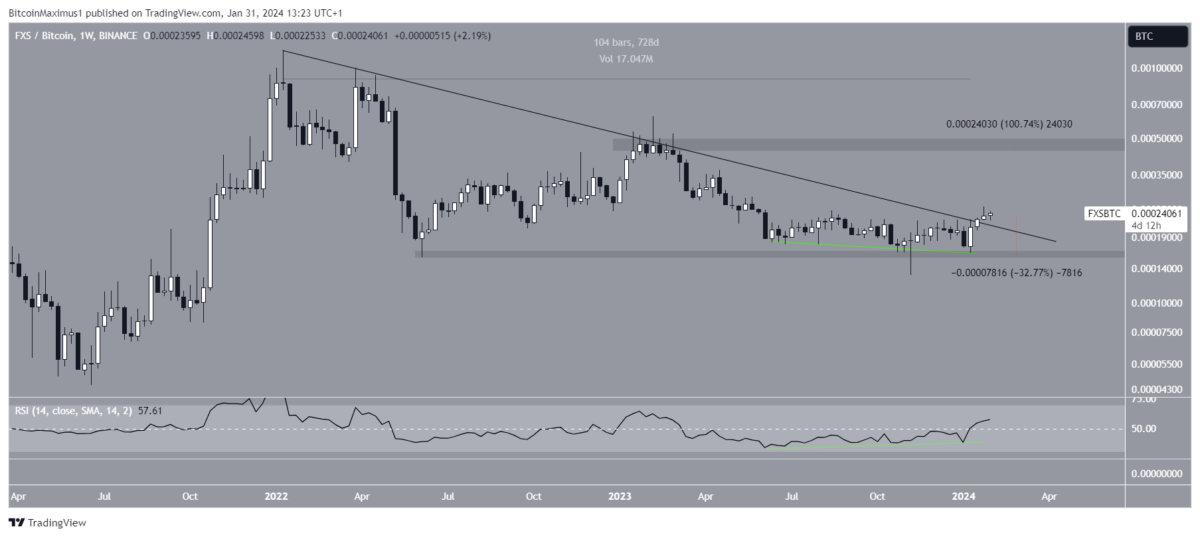
Despite this bullish FXS price prediction, a weekly close below the resistance trend line could trigger a 30% decline to ₿0.00016.
ETH price prediction: Leading altcoin creates bull divergence
The last altcoin that could outperform BTC is Ethereum (ETH). ETH price has increased along a 1,600-day ascending support trend line. Recently, the trend line was confirmed at the beginning of January (green icon), creating a major bullish candlestick. Interestingly, the weekly RSI has formed a bullish divergence. Additionally, it has moved out of the oversold zone. Previously, ETH created such a divergence when the upward move started. ETH price will break out of the descending resistance trend line (dashed), confirming the reversal of the uptrend. Then, a 50% rise to the next resistance at ₿0.08 is possible.
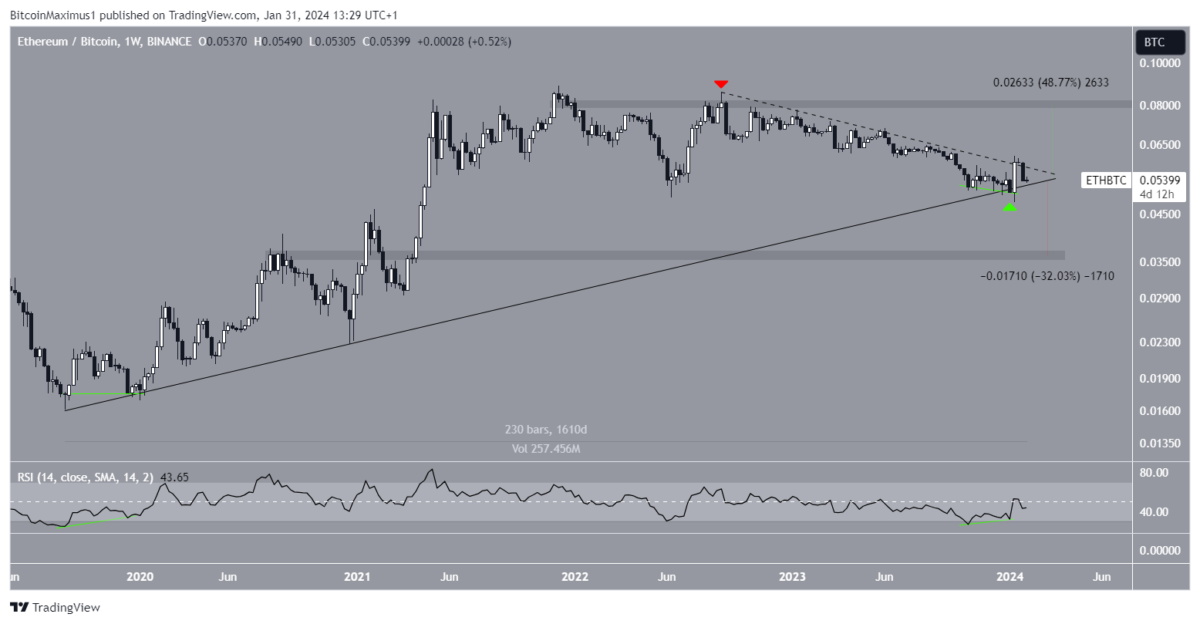
Despite the bullish ETH price forecast, a weekly close below the rising support trend line could trigger a 30% drop to the nearest support at ₿0.036.
The opinions and predictions in the article belong to the analyst and are definitely not investment advice. cryptokoin.com We strongly recommend that you do your own research before investing.
To be informed about the latest developments, follow us twitter‘in, Facebookin and InstagramFollow on and Telegram And YouTube Join our channel!