Bitcoin has fallen by 2.5% in the last 24-hour period, falling to $ 29,685.
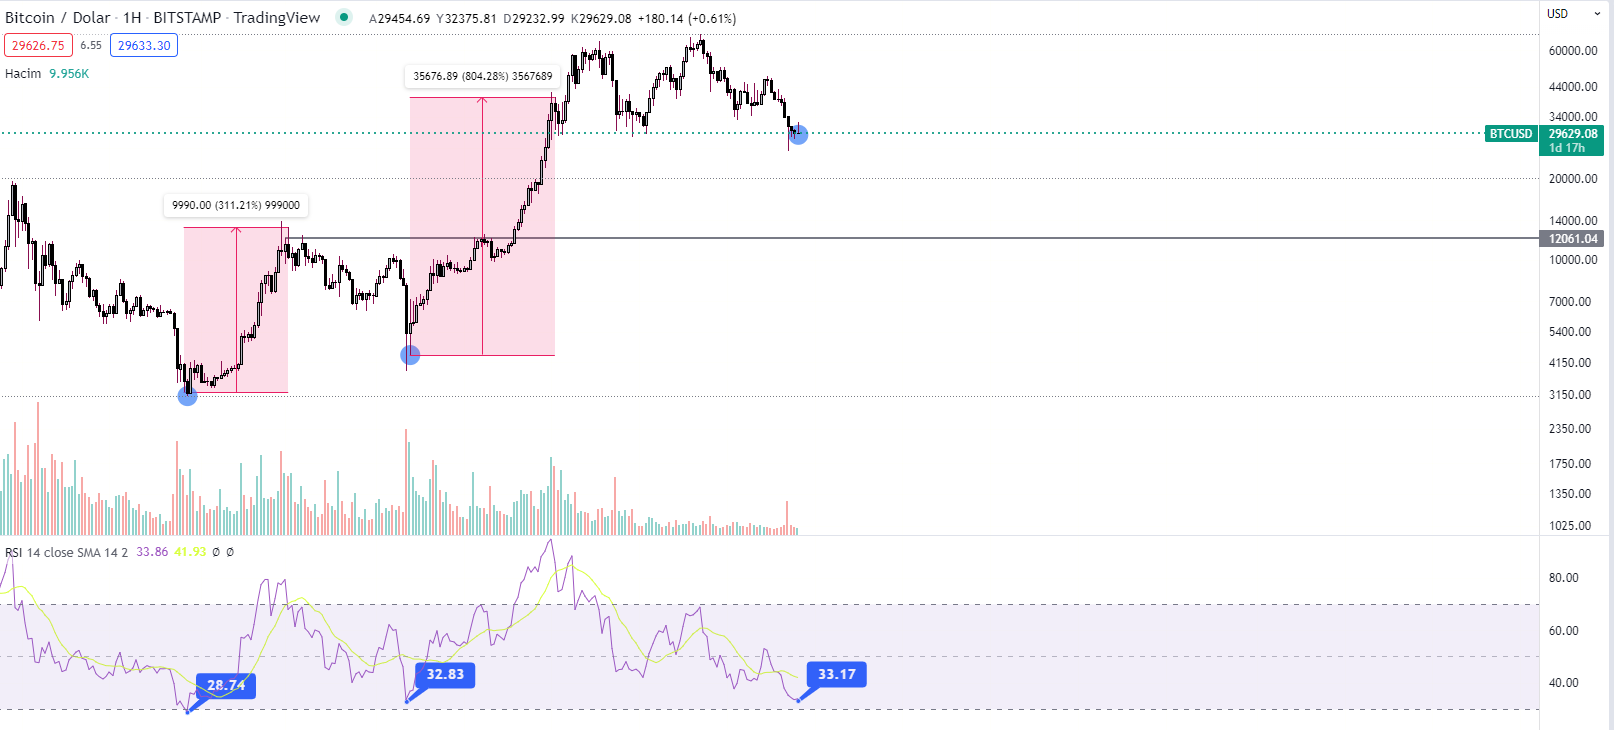
For bitcoin, which has been in a bearish period for a long time, it is a matter of curiosity where the area where it will start its upward movements.
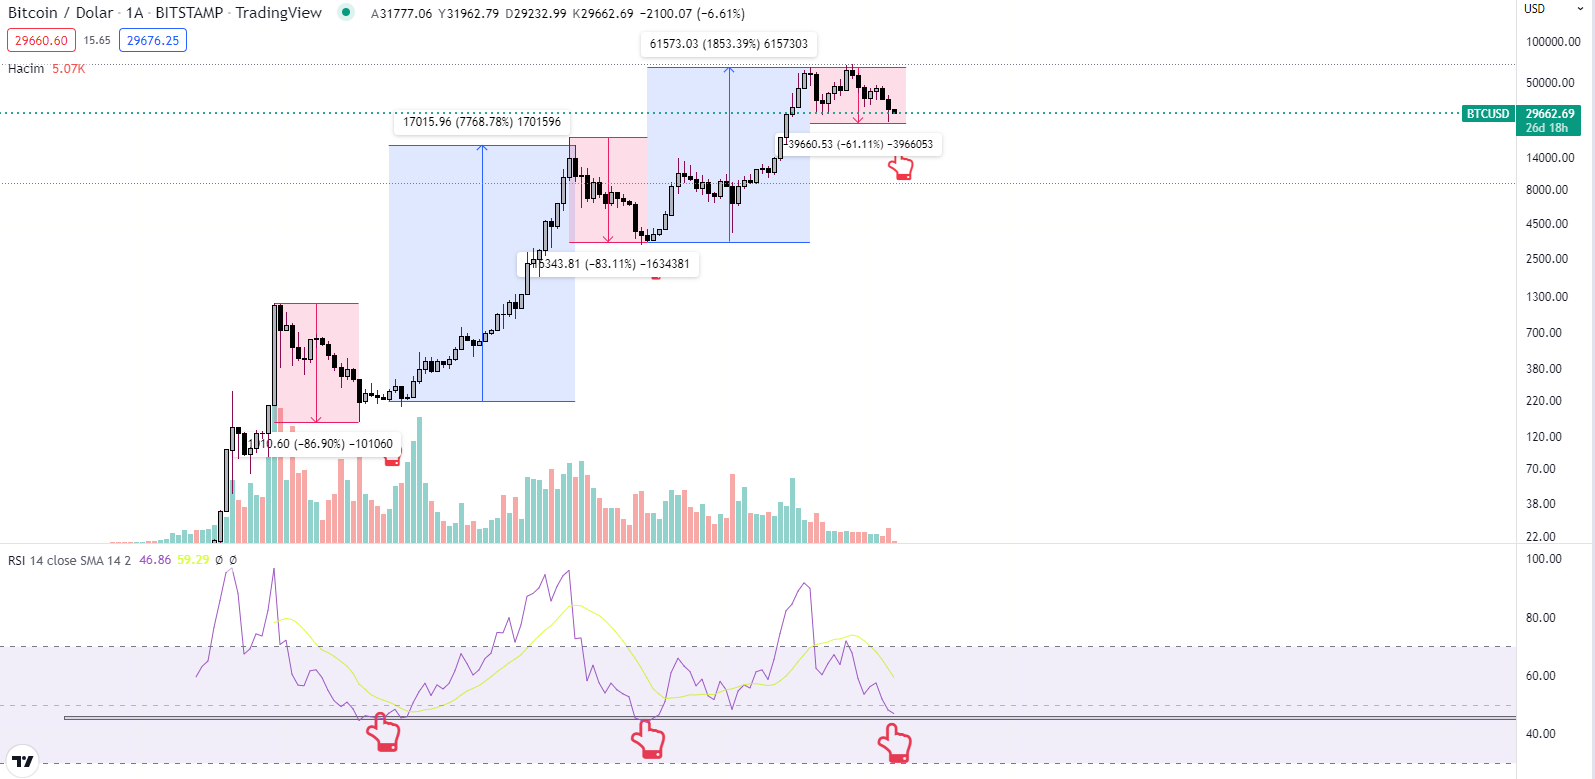
When looking at the long-term Bitcoin/USD chart, we can see that the bearish periods are shorter than the rising periods.. Bitcoin, which has dropped more than 80% in the previous bear seasons, It hasn’t dropped that much yet. However, current RSI level, August 2015- December 2017 to the RSI level, where the rise between From early 2019 to early 2021 It is very close to the RSI level, where the rising period started.
If it turns red in June 3 months to close with loss Bitcoin’s RSI level has not yet dropped as much as other seasons, but according to many analysts, it is at possible reversal levels.
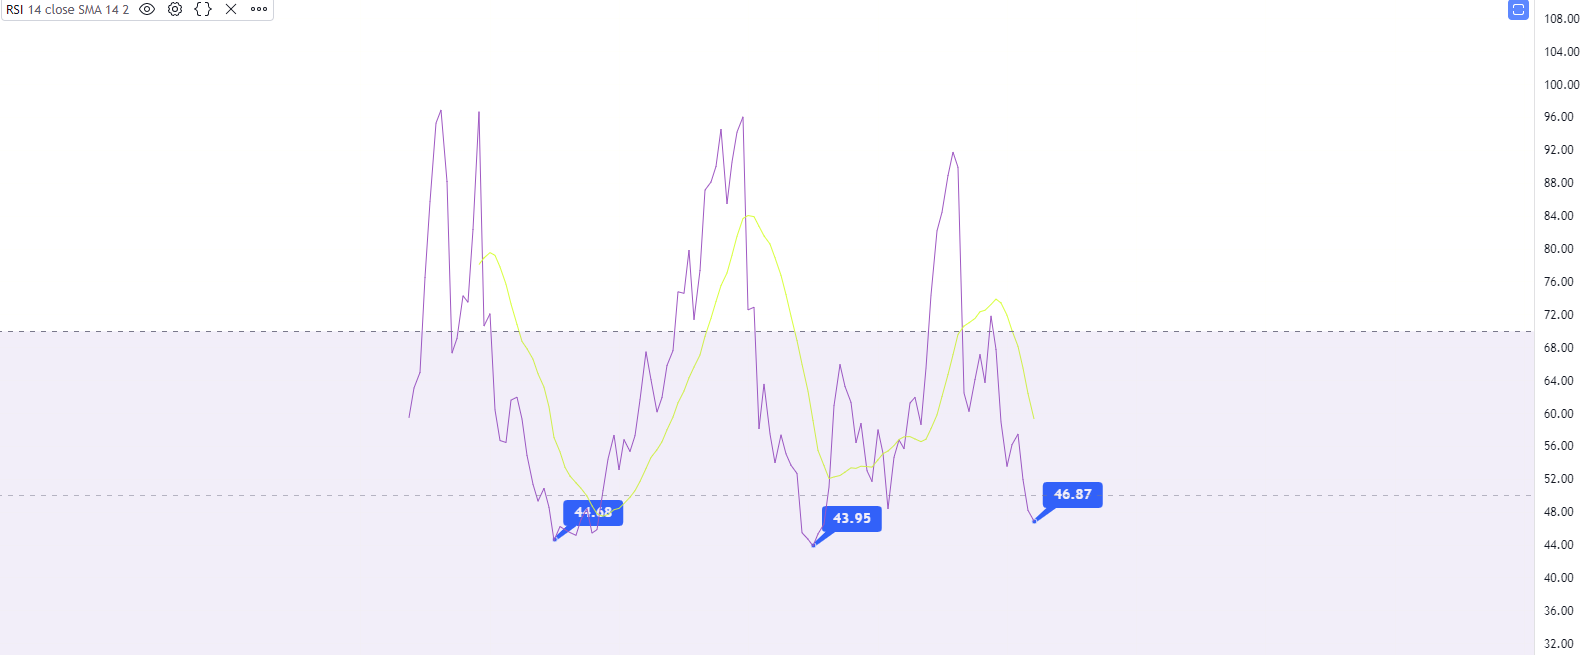
In addition, the RSI level on Bitcoin’s weekly chart is very close to the weekly RSI levels where the previous rises started.
RSI, also known as the relative strength index, in 1978 It was developed by the American J. Welles Wilder. RSI, extreme purchase and sale It works as an indicator showing the regions.
- The data contained in the content is for informational purposes only. It does not contain any investment advice.