
Zilliqa (ZIL) price made a break above the $0.0165 horizontal support area. It is now in the process of breaking out of a descending resistance line.
The daily time frame supports the recovery of the horizontal support area. Additionally, it indicates that the price is likely to increase.
Zilliqa Price Avoids Breaking From Long-Term Support
altcoin The price has been trading above the $0.0165 zone since the beginning of the year. During this time, it made several splashes in the region. But each bounce led to the formation of a lower high, which was considered a sign of weakness. The highs form a descending resistance line.
Last week, cryptocurrency It was seen that the unit broke below the $0.0165 region. However, it formed a long lower wick (green icon) and retook the zone immediately afterwards. Now, the price is in the process of breaking out of the descending resistance line. Such divergences and recoveries are bullish signs. Moreover, they often cause a trend reversal. In any case, ZIL needs to close above the descending resistance line to confirm the reversal of the uptrend.
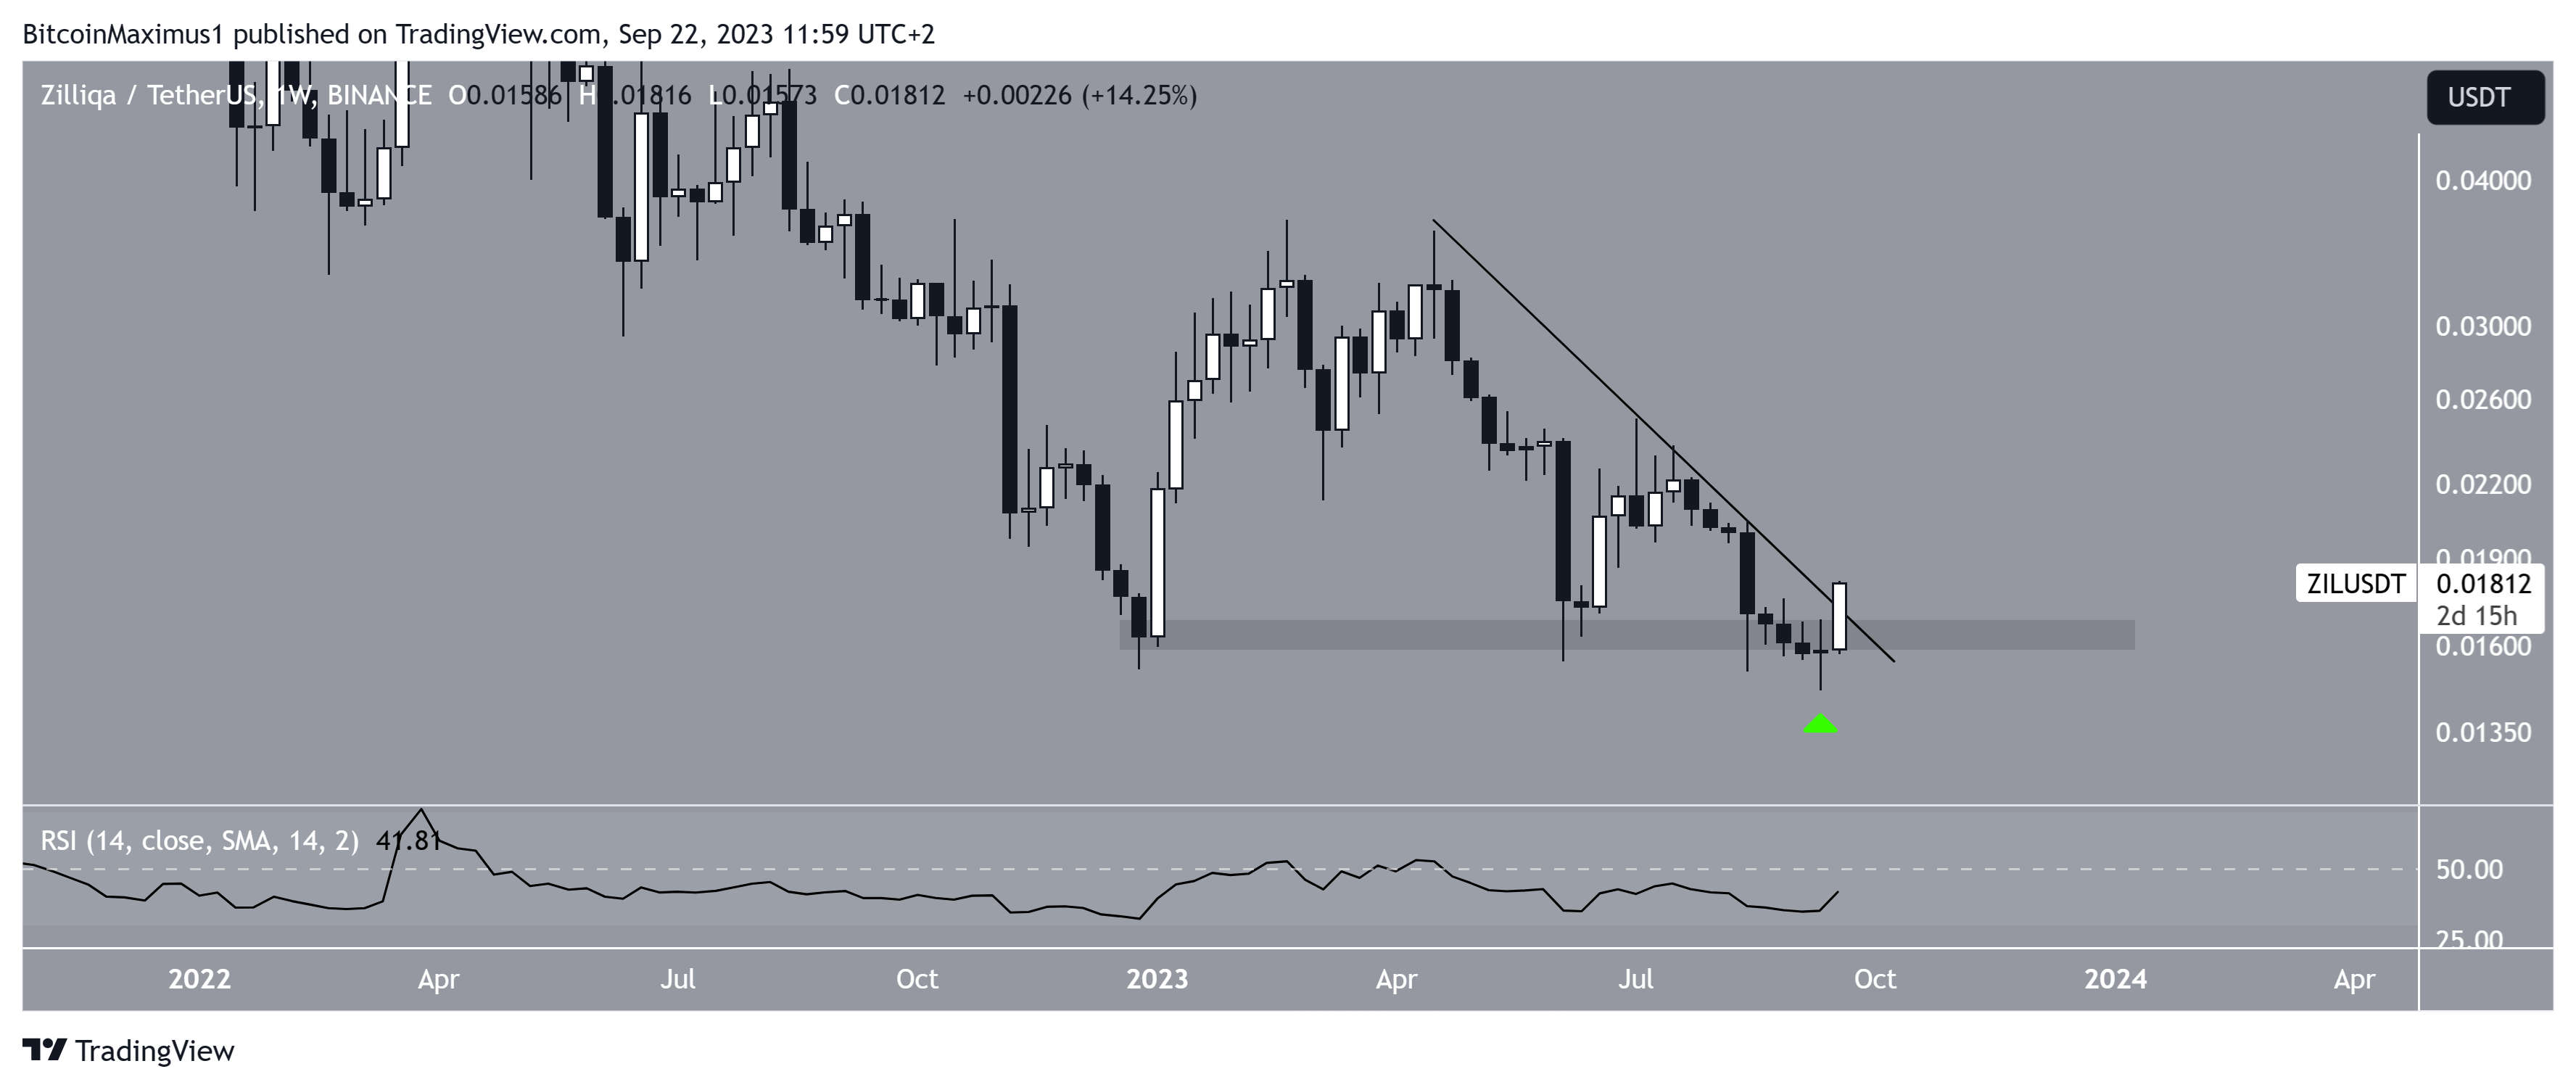
Despite this seemingly bullish price action, the RSI is still uncertain. RSI is a momentum indicator that investors use to evaluate whether a market is overbought or oversold and to determine whether an asset should be accumulated or sold. Readings above 50 and an uptrend indicate that the bulls still have the advantage, while readings below 50 indicate the opposite.
Although the indicator is increasing, it is still below 50. A close above the descending resistance line and an RSI move above 50 will confirm that the trend is upward.
ZIL Price Forecast: Double Bottom Leads to Rise
Daily time frame technical analysis supports the continuation of the increase. There are two main reasons for this.
First, the price formed a double bottom, which is considered a bullish pattern. The double bottom catalyzed the rise that led to the recovery of the $0.0165 horizontal support area.
Secondly, the double bottom is combined with a bullish divergence in the RSI (green line). This is a bullish event that occurs when a price decline is combined with a momentum increase.
This usually leads to a reversal of the uptrend. In the case of ZIL, it caused a breakout from the short-term descending resistance line.
If the rise continues, the next closest resistance area would be $0.0200, a measured upside of 13% from the current price.
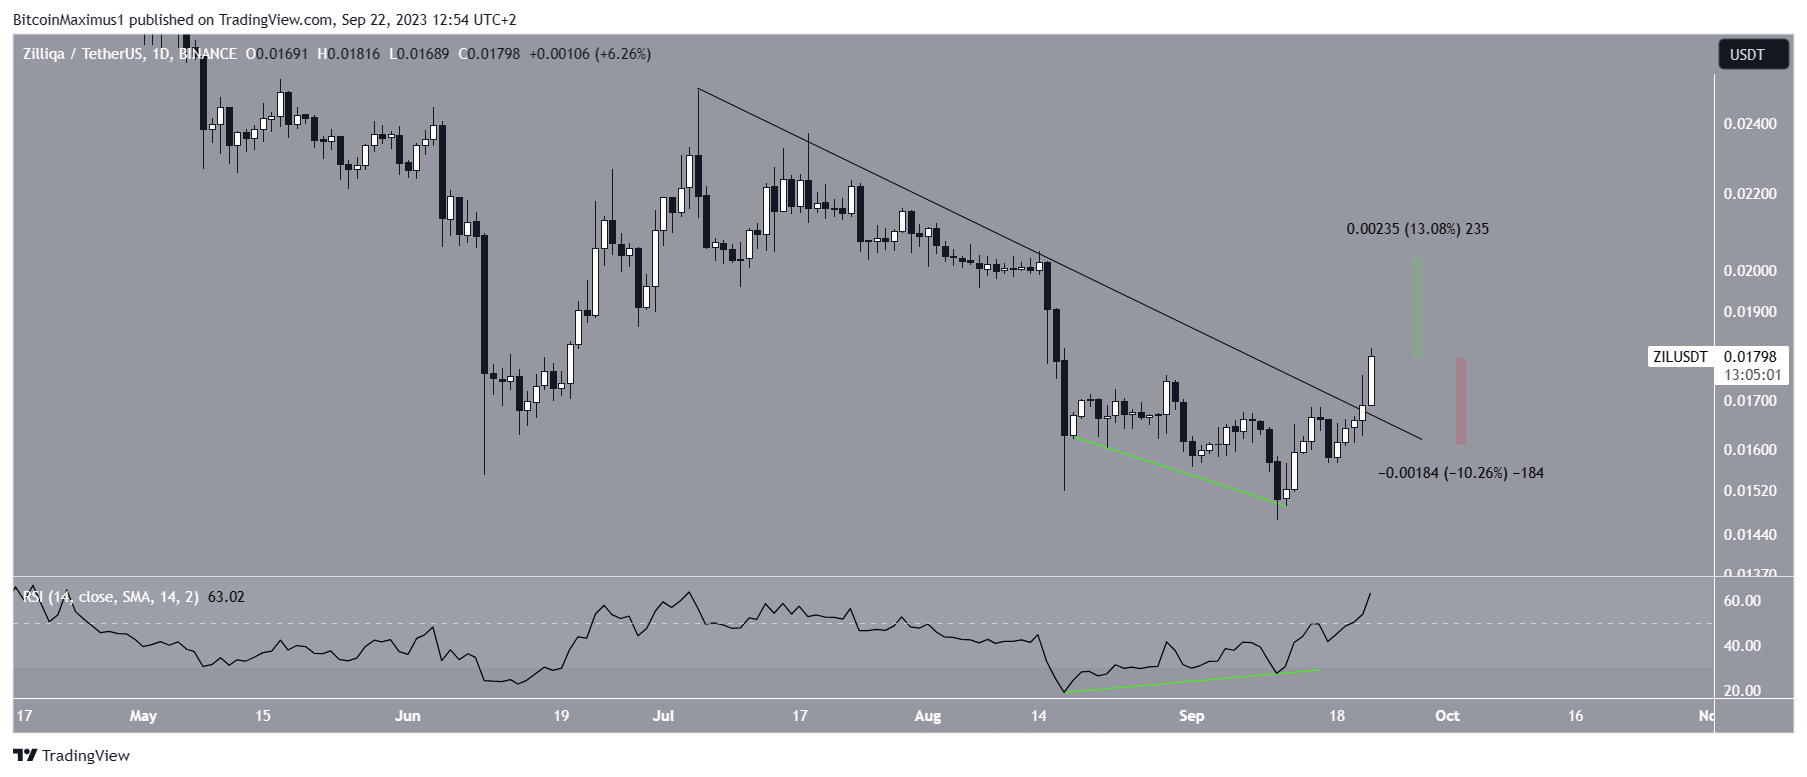
Despite this bullish ZIL price prediction, failure to sustain the increase could lead to a drop to the resistance line, currently at $0.0160.
This would be a 10% decline measured from the current price.