
Crypto analyst Ali Martinez predicts that the Cardano price will rise 44 percent. Analyst Kelvin Munene says SOL bulls are roaring as the price rises. Sandbox is making its debut, according to crypto analyst Valdrin Tahiri, this altcoin could soon follow. The analyst also says that the Icon price has reached its breaking point. Analyst Akash Grimath also notes that the DOT bulls have crossed the critical hurdle.
Cardano (ADA) price could rise 44%
Cardano, one of the leading cryptocurrencies, may be on the verge of a major breakout, according to crypto expert Ali. The analyst predicts that with a potential value increase of 44%, the cryptocurrency will reach a value of $ 0.60 and will excite investors for the future.
Ali is known for his expertise in the crypto world and follows Cardano’s price movements closely. He recently shared his views on the cryptocurrency, stating that he is “ready to confirm the head and shoulders pattern.” If Ali’s prediction turns out to be correct, ADA could rise 44% from its current price of $0.415 to $0.60. This will be an important milestone for Cardano, which is steadily gaining momentum in the cryptocurrency market.
However, in the volatile world of cryptocurrencies, predictions are not guaranteed. It is not yet clear whether the head and shoulders pattern will actually be confirmed and whether ADA will experience the breakout that Ali predicted. However, if Cardano continues to make progress in its development and gains more support from the crypto community, there is definitely potential for its price to rise in the coming months.
SOL bulls roar as altcoin price rises!
cryptocoin.comAs you can follow, Solana (SOL) fluctuated earlier in the day with the bears aiming to disrupt the market’s upward momentum. Due to these oscillations, SOL price rose from a 24-hour low of $23.34 to a monthly high of $24.34 in just a few hours. At the time of this writing, bullish control was still strong, with SOL trading at $24.15, up 1.87% from the previous day’s close.
The positive market mood and strong investor buying pressure could push SOL price above the 30-day high and traders could target the next resistance levels at $25.00 and $26.00. However, traders should be wary of potential market corrections and profit-taking activities that could lead to minor price drops and volatility in the SOL market with support levels between $22.00 and $20.00.
SOL market cap was up 0.87% to $9,428,550,492 while 24-hour trading volume was down 12.74% to $1,059,363,899. This move could mean that investors are hoarding SOL tokens rather than actively buying and selling them.
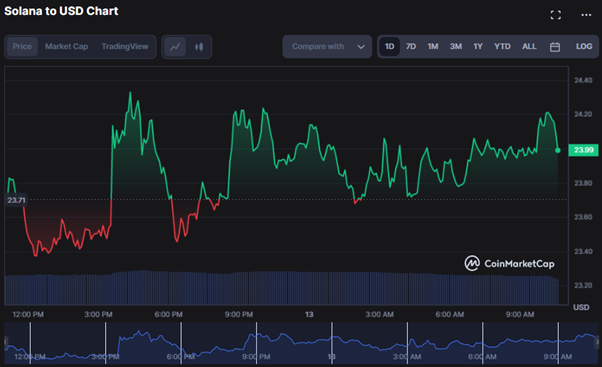
The Average True Range (ATR) value of 0.60 on the SOL price chart shows that the bullish momentum is solid and volatile. This could be a buying opportunity. However, traders should be wary of sharp price changes.
SAND debuts, this altcoin could follow
Decentraland (MANA) price has fallen within a descending parallel channel since Feb. Such channels often contain corrective moves, meaning a bullish breakout is expected. On April 1, the MANA price went out of the channel. This followed the breakout of the RSI from the bearish trendline (green line). However, the price failed to climb above the $0.61 resistance area. This needs to be done for the trend to be considered bullish.

While the daily RSI has not broken above 50, the ABC retracement (black) completed inside the channel suggests a breakout from the $0.61 area is more likely than rejection. In this case, the altcoin price could rise to $0.82. However, if a rejection occurs instead, a drop to the $0.50 support could follow.
Technical analysis on the daily time frame shows that Sandbox (SAND) price has been increasing since March 11 and bounced off the $0.53 horizontal support area (green icon). Shortly after, the daily RSI broke out of the downtrend trendline (green line). This is a sign that often precedes price breaks. As expected, the altcoin price broke out of a descending resistance line on April 4. However, despite the breakout, it has not yet started the fast part of the increase.
If the upside continues, there will be a strong resistance at $0.69. This is the last resistance area before the $0.84 high. However, if the rally loses momentum, SAND price could drop to the descending resistance line and possibly drop to the $0.53 horizontal support zone. Similar to MANA, the daily RSI is just above 50, which is a sign of an uncertain trend. However, the completed ABC retracement and the breakout from the resistance line make a breakout slightly more likely.

As a result, the SAND and MANA price trend is bullish and an increase is expected in April. A rejection from the nearest resistance areas could invalidate this bullish forecast and trigger a sharp decline.
Icon (ICX) price reaches breaking point
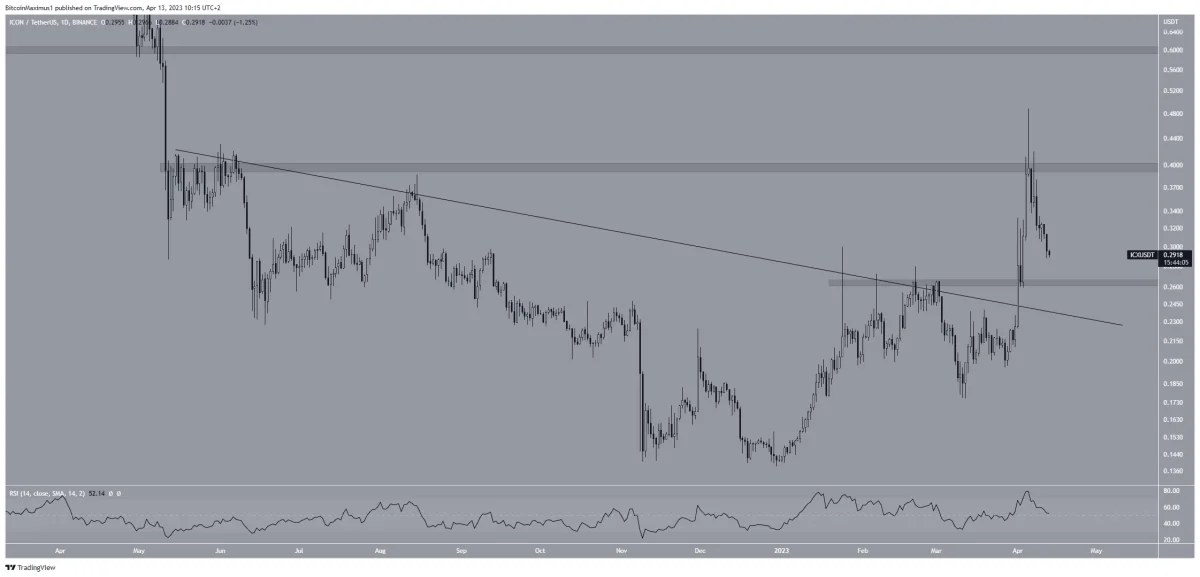
ICX price broke out of a descending resistance line on April 1. Four days later it reached the maximum price for the year at $0.49. However, although this apparently resulted in a break above the $0.40 resistance area, the price formed a long upper wick over the next 24 hours and then fell. Such suppositories are considered signs of selling pressure.
The altcoin price has since declined and it is approaching the horizontal support area of $0.26. Despite the sharp decline, the daily RSI has yet to create any bearish divergence. Moreover, it is still trading above 50, which is a sign of an uptrend. As a result, ICX price could bounce off the $0.26 horizontal support area and make another attempt to move towards the $0.40 resistance. A breakout from the latter could catalyze a pump of up to $0.60. On the other hand, a close below $0.26 might trigger a drop to $0.23.
Technical analysis from the six-hour time frame offers a bullish ICX price forecast for April. The main reason for this is the number of waves that bode well for the future price.
Altcoin price is in the third wave of the five-wave upside move (white). This is usually the sharpest of the five waves. The lower wave number is given in black and shows that ICON price has completed a fourth wave retracement. The pullback could end in the middle of the previous ascending channel (green circle), which also coincides with the $0.26 horizontal support area. Later, ICX price could rise to the long-term resistance at $0.60.
While the wave count is bullish, a break below the first wave high of $0.24 (red line) will invalidate this count. If true, this could lead to a decline to the $0.18 support.

As a result, the most likely ICX price prediction is a rise towards the $0.60 long-term resistance area. This bullish prediction will be invalidated with a drop below $0.24. In this case, the price could drop to $0.18.
This altcoin price hints at bullishness
Polkadot (DOT) price formed the $6.36 to $8.79 range in June 2022 and has been below it for a while. The last two bullish moves to retrace the range have failed and the buyers’ latest attempt seems to be working as the DOT looks ready to take a stand.
The first target level for altcoin price is $7.57, which is the mid-range of the range, which means a 17% rise. However, breaking this barrier could extend the DOT bulls’ journey to $8.79, bringing the overall gain to 36%. Therefore, traders need to keep a close eye on the altcoin price as it could start an impressive uptrend soon.

Regardless of whether it has recently entered the $6.36 to $8.79 range, DOT price needs to hold its ground. Failure to do so may indicate a weak buyer camp. If the DOT turns the $6.09 support level into a resistance barrier, it will create a lower low and invalidate the bullish argument. Such a development could cause Polkadot price to drop to $5.63.
Contact us to be instantly informed about the last minute developments. twitter‘in, Facebookin and InstagramFollow and Telegram And YouTube join our channel!
Risk Disclosure: The articles and articles on Kriptokoin.com do not constitute investment advice. Bitcoin and cryptocurrencies are high-risk assets, and you should do your due diligence and do your own research before investing in these currencies. You can lose some or all of your money by investing in Bitcoin and cryptocurrencies. Remember that your transfers and transactions are at your own risk and any losses that may occur are your responsibility. Cryptokoin.com does not recommend buying or selling any cryptocurrencies or digital assets, nor is Kriptokoin.com an investment advisor. For this reason, Kriptokoin.com and the authors of the articles on the site cannot be held responsible for your investment decisions. Readers should do their own research before taking any action regarding the company, assets or services in this article.
Disclaimer: Advertisements on Kriptokoin.com are carried out through third-party advertising channels. In addition, Kriptokoin.com also includes sponsored articles and press releases on its site. For this reason, advertising links directed from Kriptokoin.com are on the site completely independent of Kriptokoin.com’s approval, and visits and pop-ups directed by advertising links are the responsibility of the user. The advertisements on Kriptokoin.com and the pages directed by the links in the sponsored articles do not bind Kriptokoin.com in any way.
Warning: Citing the news content of Kriptokoin.com and quoting by giving a link is subject to the permission of Kriptokoin.com. No content on the site can be copied, reproduced or published on any platform without permission. Legal action will be taken against those who use the code, design, text, graphics and all other content of Kriptokoin.com in violation of intellectual property law and relevant legislation.