
Cryptocurrency experts have announced their predictions for the next week! These 4 altcoin projects may be on the rise soon! Here are the details…
Leading cryptocurrency experts explained: “Bullshit is near for these 4 altcoins!”
As the cryptocurrency market has been on the decline in the last 24 hours, Fred Pye, CEO of 3iQ, Canada’s first Bitcoin fund issuer, said in an interview that “with the disappearance of FOMO in Bitcoin”, institutional investors and portfolio managers are “serious” to Bitcoin. He said he started to look at it as a “space”.
While analysts are bullish in the long-term, the short-term picture looks uncertain as the price has been stuck in a range for the past few days. Analysts are waiting for the trend movement to start next week or next week. So, if Bitcoin makes an uptrend, which altcoins could follow? Experts explained…
Bitcoin (BTC) price analysis
Bitcoin is trading near the support line of the symmetrical triangle but the bulls failed to push the price above it. This indicates that the bears are active at higher levels.

The falling 20-day exponential moving average ($27,481) and the relative strength index below 42 suggest the bears are taking advantage. If the sellers sink the price below the immediate support of $26.361, Bitcoin could drop into the key support zone of $25,800 to $25,250. Buyers are expected to protect this area with all their might because if they fail, the pair could drop as low as $20,000. Conversely, if the bulls push the price above the 20-day EMA, it could attract more buying. The pair may then rise towards the resistance line of the triangle. If this barrier is breached, the pair could start its journey towards $32,400.
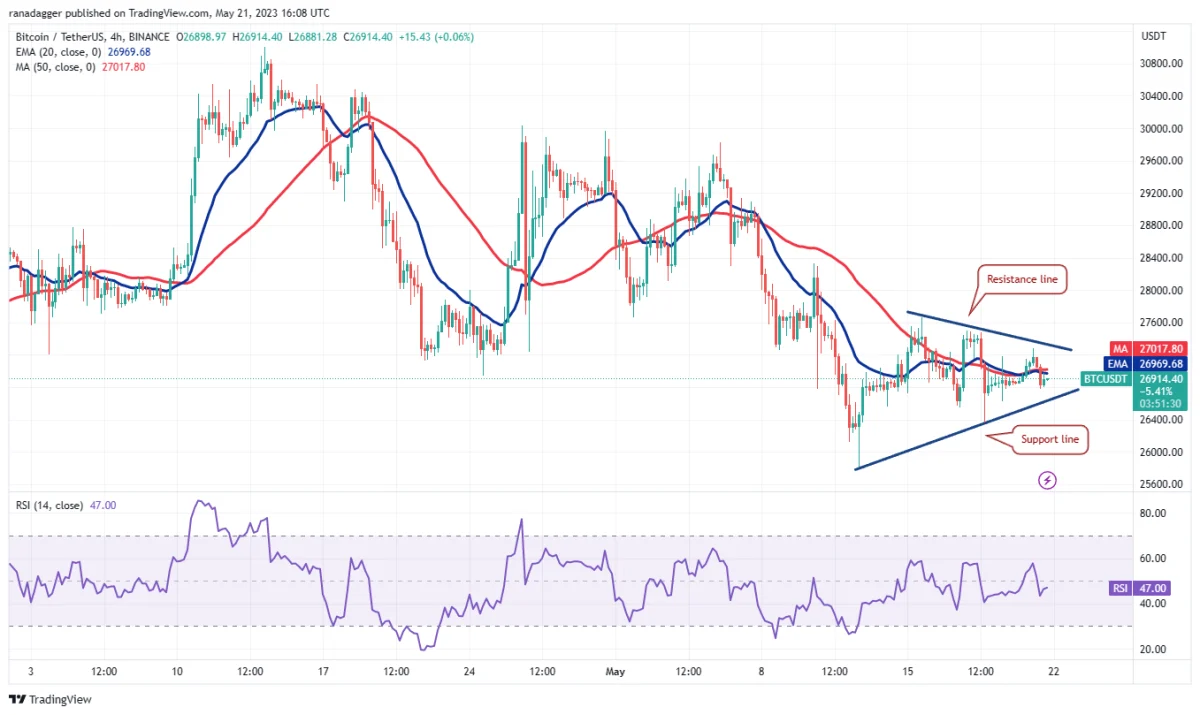
The 4-hour chart for BTC shows a symmetrical triangle formation forming between the bulls and bears, indicating uncertainty. The flattening moving averages also point to a balance between supply and demand. If the price drops below the triangle, the short-term trend will turn negative and the pair could drop to $25,800. The formation target of the triangle is $24.773. This bearish view will be negated if the price rises above the triangle. The pair could then climb towards the $28,400 and then the $29,165 pattern target.
Ripple (XRP) price analysis
XRP is trying to start a recovery. Buyers have been holding the price above the 20-day EMA ($0.45) since May 16, but have been unable to overcome the hurdle at the 50-day SMA ($0.47).

The 20-day EMA has started to rise and the RSI is just above the midpoint, indicating that the bulls have a slight advantage. This increases the probability of a rally above the 50-day SMA. The XRP/USDT pair could then rally to $0.54 and eventually $0.58. This region is likely to be the scene of aggressive selling by the bears.
The first support to watch on the downside is the 20-day EMA. Sellers will need to push the price below this level to gain the upper hand. The pair could then decline to $0.43 and then the crucial support at $0.40.

The 4-hour chart for XRP shows that the recovery has changed direction from the downtrend line. This shows that the bears are fiercely holding the downtrend line. Sellers are trying to keep the price below the 20-EMA and extend the pullback to the 50-SMA. Instead, if the price turns up from the current level and rises above the downtrend line, it will indicate the start of a short-term uptrend. A minor resistance is at the $0.48 level but it is likely to be surpassed. The pair could rally to $0.54 later.
Litecoin (LTC) price analysis
The popular cryptocurrency Litecoin has been trading in a tight range for the past few days between the 50-day SMA ($89) and the overhead resistance of $96. This shows the indecision between the bulls and bears.

The 20-day EMA ($88) for LTC has turned up and the RSI is in the positive zone, indicating that the bulls have an advantage. This increases the likelihood of a rally above the $96 resistance. If this happens, the LTC/USDT pair could rise as high as $106. This level can again attract strong selling by the bears. This positive view will be invalidated in the near term if the price declines and dips below the moving averages. Such a move would indicate that the pair could be stuck between $79 and $96 for a while.

The 4-hour chart for the popular altcoin project Litecoin shows the bulls trying to defend the 20-EMA. This marks a shift in sentiment from selling on rallies to buying on dips. If the price bounces off the current level, the bulls will again try to break through the general barrier of $96. But the bears will not give up without a fight. They are trying to push the price below the 20-EMA. If they are successful, the pair could drop as low as the 50-SMA. A collapse of this support could open the doors for a drop to $86 and then to $82.
Render Token (RNDR) price analysis
Render Token (RNDR) is in an uptrend. Buyers pushed the price above the overhead resistance of $2.60 on May 21, but the long wick on the candlestick indicates selling at higher levels.
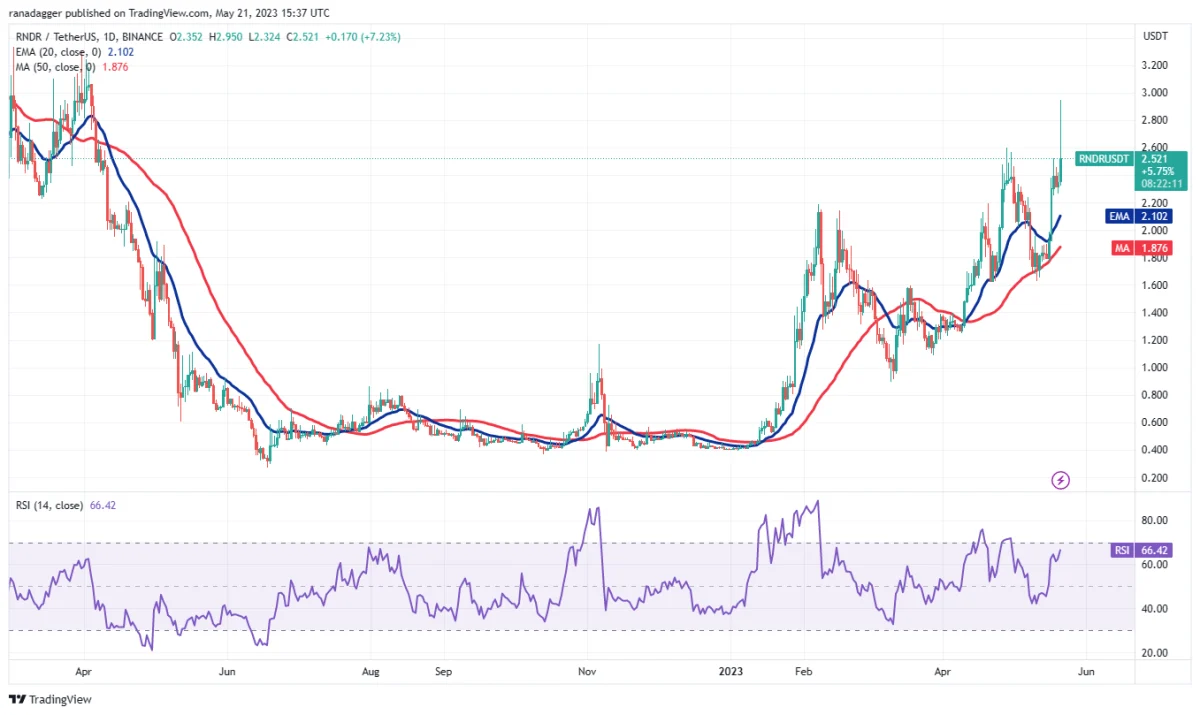
The upward sloping moving averages and the RSI just below the overbought zone indicate that the bulls are in command. Buyers will make another attempt to push the price above the psychological barrier to $3. If they do, the RNDR/USDT pair could rally to $3.35. The first support to watch on the downside is the 20-day EMA ($2.10). If this level gives way, it will indicate that a break above $2.60 could be a bull trap. The pair could then decline to the 50-day SMA ($1.87).
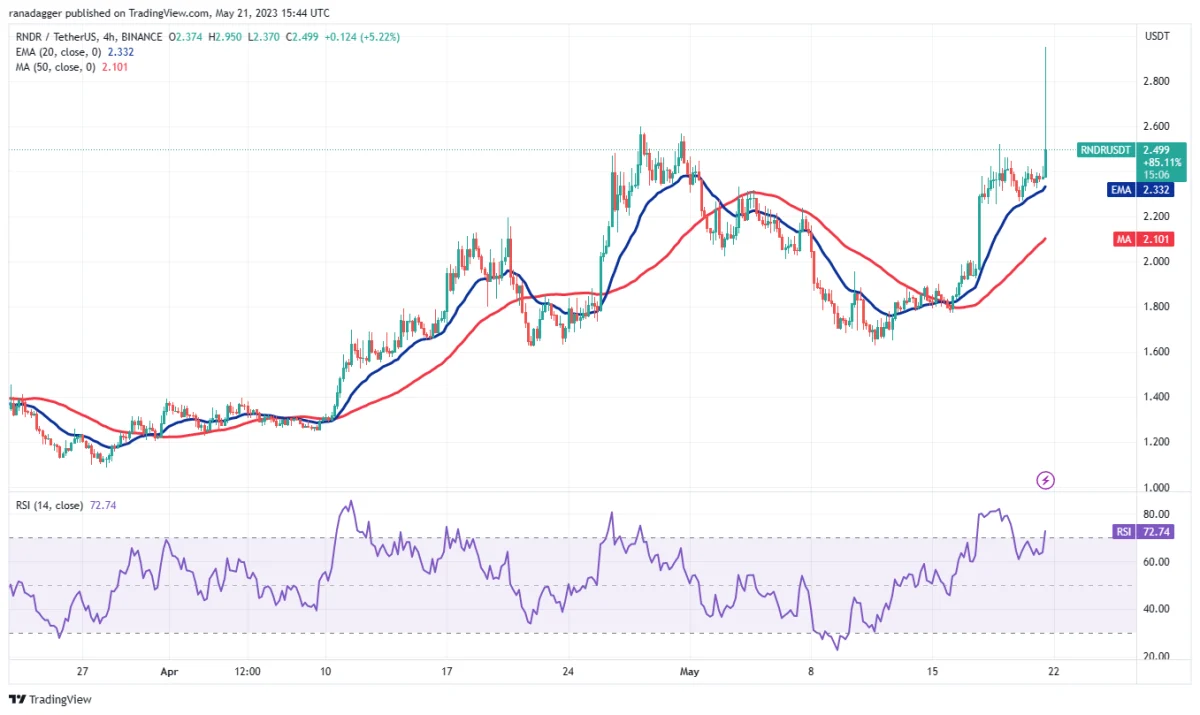
For the RNDR, the Bulls are struggling to hold the price above the overhead resistance of $2.60, indicating the possibility of a bull trap. Sellers will try to strengthen their positions by pulling the price below the immediate support at the 20-EMA. If they do, the pair could slide as low as the 50-SMA. However, the rising moving averages and the RSI in the overbought zone suggest that buying lower levels are likely. If buyers push the price above $2.60 and protect it, the pair could rally as high as $3.
Conflux (CFX) price analysis
Conflux (CFX) is trading inside the descending channel formation. The bulls bought the dip to the support line on May 12, signaling solid demand at lower levels.

The 20-day EMA ($0.29) has flattened out and the RSI is near the midpoint, suggesting that selling pressure is easing. Buyers attempted to break through the general hurdle at the 50-day SMA ($0.32) on May 16, but the bears held their ground. A minor positive point in favor of the bulls is that they did not allow the price to drop below the 20-day EMA. This signals to buy on dips. The bulls are likely to make another attempt to push the price above the 50-day SMA. If successful, Conflux may again reach the downtrend line, which is likely to act as a tough resistance.
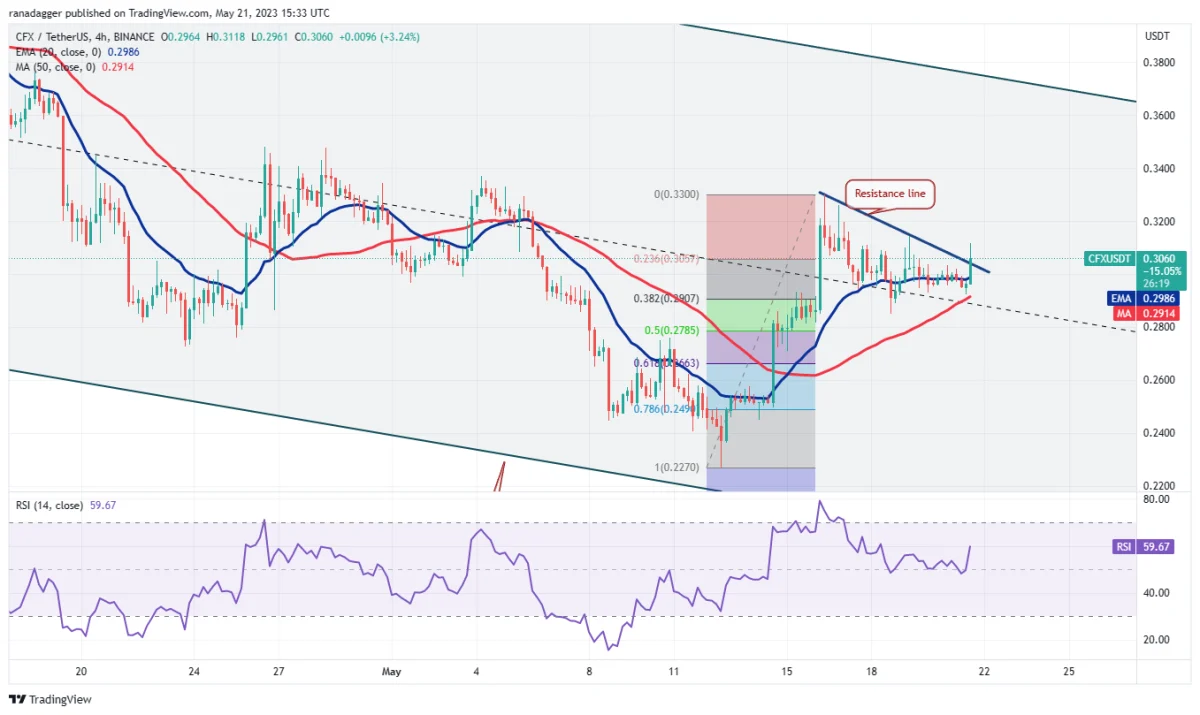
The 4-hour chart shows the price correcting the sharp rally from $0.22 to $0.33. Buyers are trying to defend the 38.2% Fibonacci retracement level of $0.29, which is a positive sign. If the buyers hold the price above the resistance line, it will indicate that the bulls are back in the driver’s seat. The pair could rally to $0.33 and later to $0.37. Alternatively, a break and close below $0.29 for CFX could start a deeper correction towards $0.28 and then $0.27.
Contact us to be instantly informed about the last minute developments. twitter‘in, Facebookin and InstagramFollow and Telegram And YouTube join our channel!
Risk Disclosure: The articles and articles on Kriptokoin.com do not constitute investment advice. Bitcoin and cryptocurrencies are high-risk assets, and you should do your due diligence and do your own research before investing in these currencies. You can lose some or all of your money by investing in Bitcoin and cryptocurrencies. Remember that your transfers and transactions are at your own risk and any losses that may occur are your responsibility. Cryptokoin.com does not recommend buying or selling any cryptocurrencies or digital assets, nor is Kriptokoin.com an investment advisor. For this reason, Kriptokoin.com and the authors of the articles on the site cannot be held responsible for your investment decisions. Readers should do their own research before taking any action regarding the company, assets or services in this article.
Disclaimer: Advertisements on Kriptokoin.com are carried out through third-party advertising channels. In addition, Kriptokoin.com also includes sponsored articles and press releases on its site. For this reason, advertising links directed from Kriptokoin.com are on the site completely independent of Kriptokoin.com’s approval, and visits and pop-ups directed by advertising links are the responsibility of the user. The advertisements on Kriptokoin.com and the pages directed by the links in the sponsored articles do not bind Kriptokoin.com in any way.
Warning: Citing the news content of Kriptokoin.com and quoting by giving a link is subject to the permission of Kriptokoin.com. No content on the site can be copied, reproduced or published on any platform without permission. Legal action will be taken against those who use the code, design, text, graphics and all other content of Kriptokoin.com in violation of intellectual property law and relevant legislation.