
The majority of analysts working to pinpoint Bitcoin’s peak draw on data from 2013 and 2017.

We observe that there are similar movements in the halving-based cycles that take place every 4 years. Combining these similarities, cryptocurrency analyst TechDev stated that we still have a ways to go in Bitcoin, and identified possible peaks.

In this regard, we will cite a few graphs and metrics that the analyst makes use of. However, it is useful to remind beforehand. Just because it was like this before doesn’t mean it will be like this again. That’s why he underlines that everyone at TechDev should manage their own risk.
The analyst first looks at the chart that deals with the logarithmic growth of Bitcoin, which we have used in our analysis before.

The analyst states that after the deep correction at the fib log 1.618 level in the previous cycles, Bitcoin rose to the log 2.272 level and reached the peak in this way. Accordingly, at the end of this cycle in Bitcoin, the price will be around $200,000. According to the analysis made on the 2-week chart, we still have a long way to go in RSI.
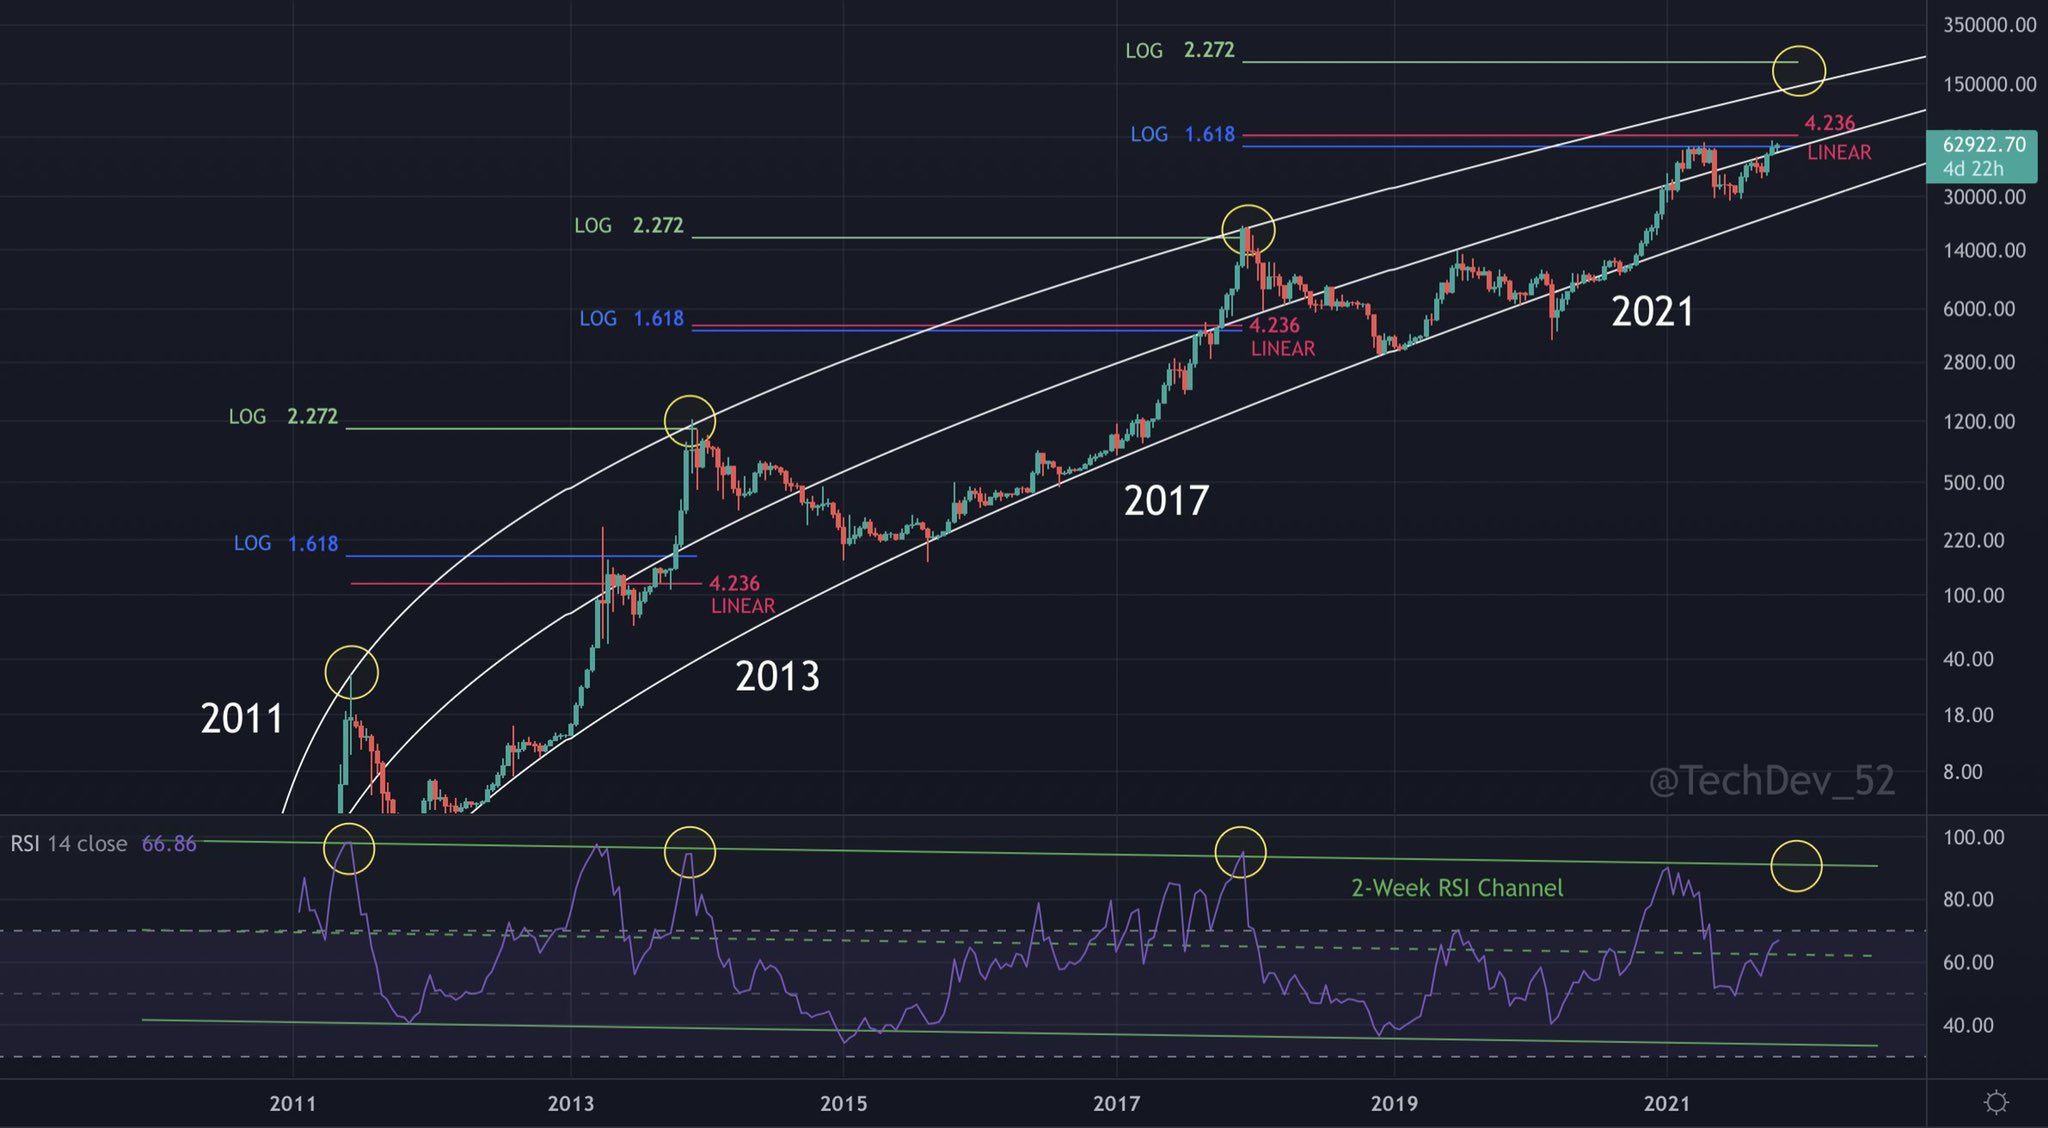
In another graph, the analyst pointed out the levels with technical indicators (RSI, RVI, Stock RSI, Vortex VI) in 2011, 2013 and 2017, and stated that there are similarities in all cycles, and that we still have a way to go in the current table.
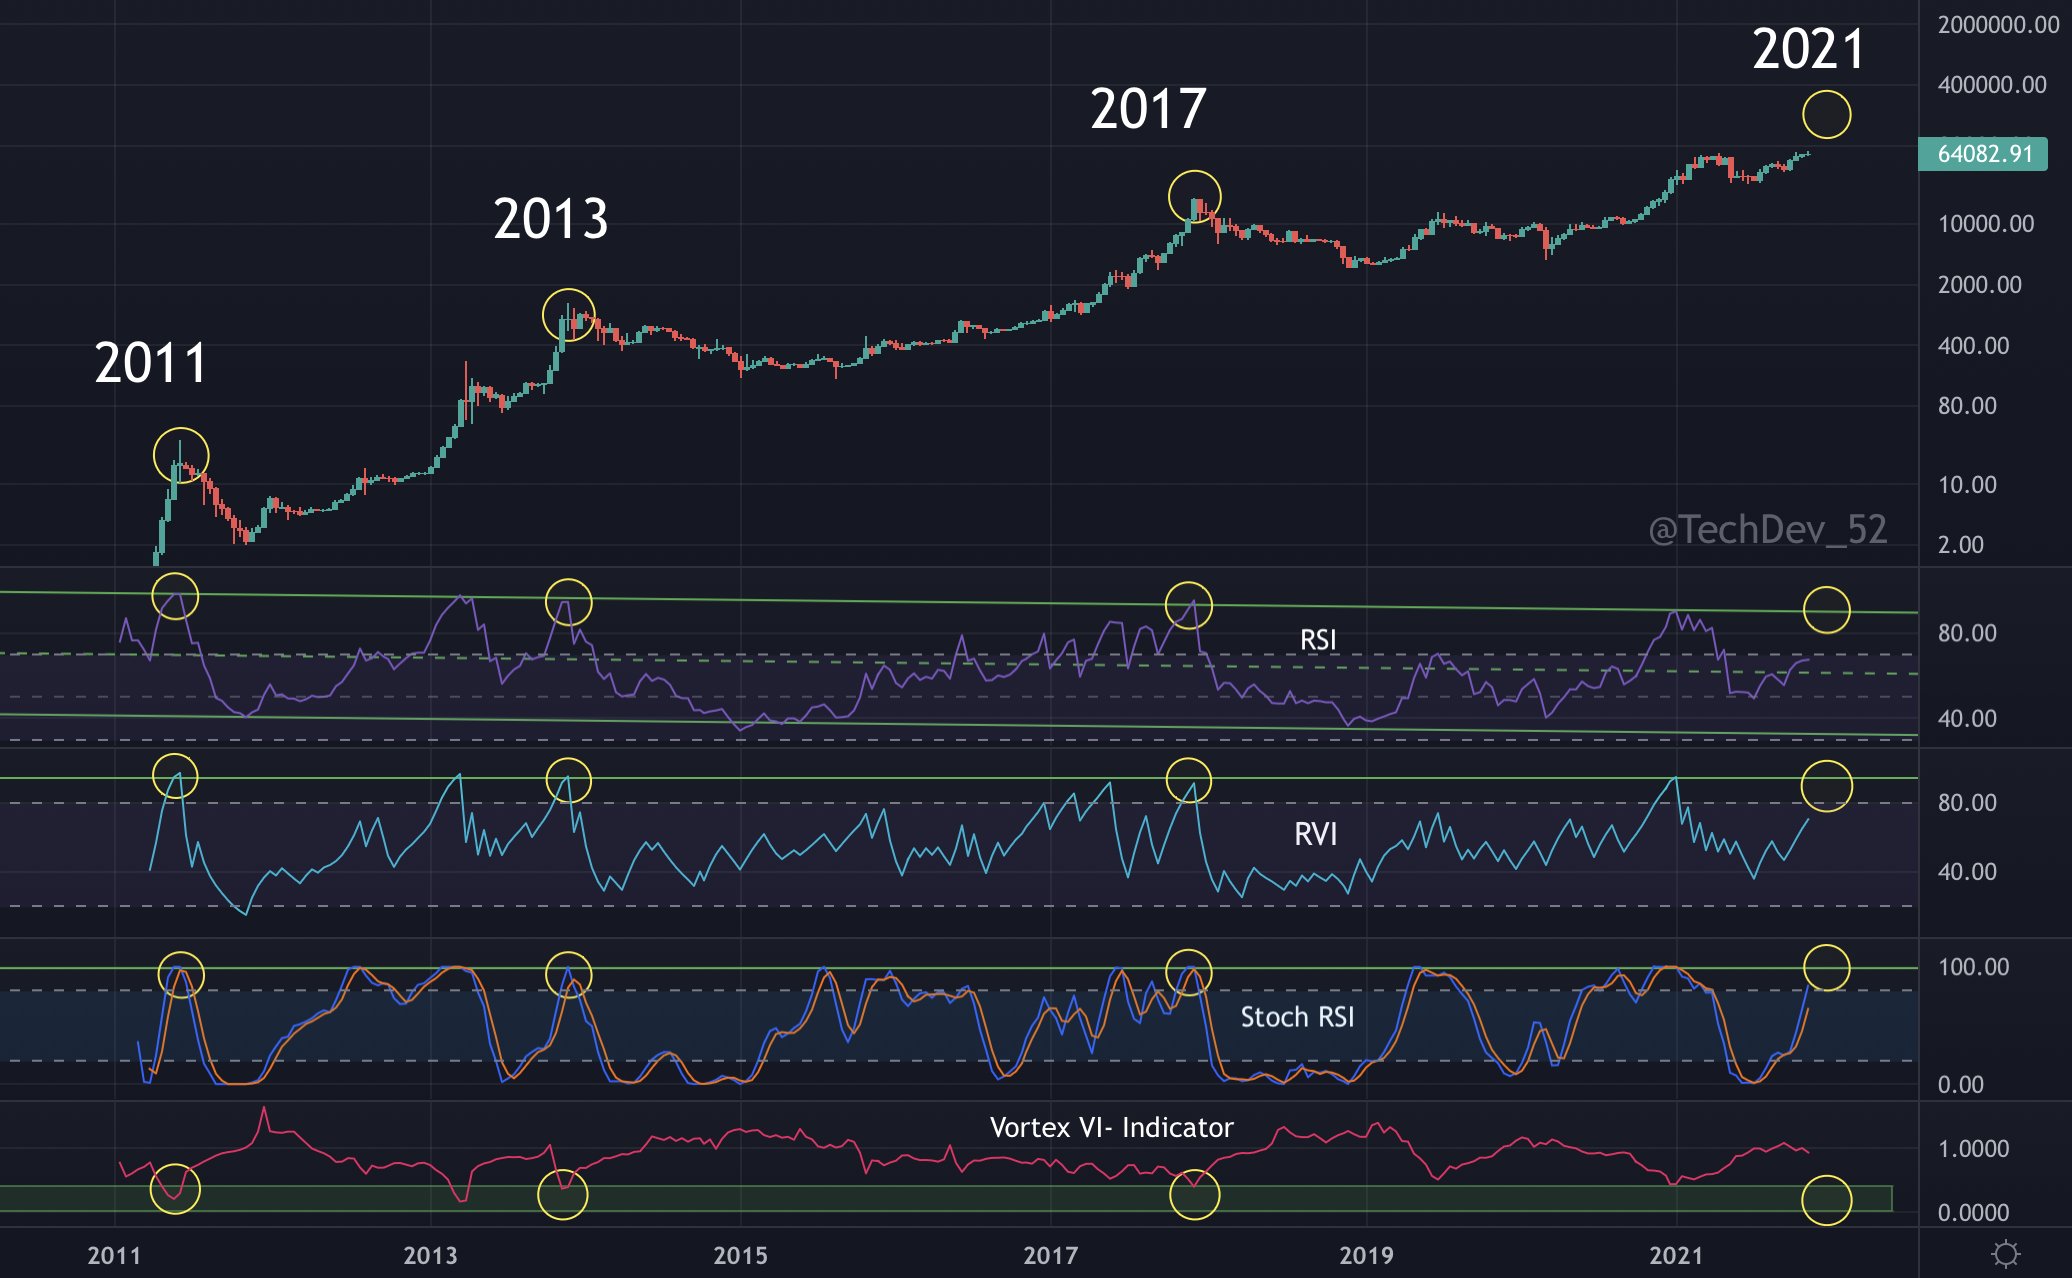
When we examine the graphs, we see that we are approaching the last stages of the cycle, but if history repeats itself, we are on the eve of a sharp rise.
The charts above are weekly and 2-week charts. Therefore, it does not give an idea about very short-term fluctuations. Please manage your own risk.
*Not Investment Advice.