
@el_crypto_prof, known as a cryptocurrency trader, posted on his in the analysis altcoin He presented his views on the market. The trader believes that the trend in the market is positive and a rise in prices is just a matter of time. According to Trader’s prediction, the market value could climb above $1.23 trillion in the coming months.
NEWS CONTINUES BELOWThe biggest move for Altcoins is still to come imo.
If you’ve been following me long enough, you’ll know that I’ve been sharing this chart here for months while bears have been calling for lower prices.
NEWS CONTINUES BELOWStick with your plan. I’m excited about what’s coming.🫡 pic.twitter.com/KmWIFgIH6e
— 𝕄𝕠𝕦𝕤𝕥𝕒𝕔ⓗ𝕖 🧲 (@el_crypto_prof) November 21, 2023
NEWS CONTINUES BELOW
From a shorter-term perspective, the altcoin has formed a symmetrical triangle formation on the daily chart for market cap (TOTAL2). This particular formation shows that the expectation of a possible breakout in the market is increasing.
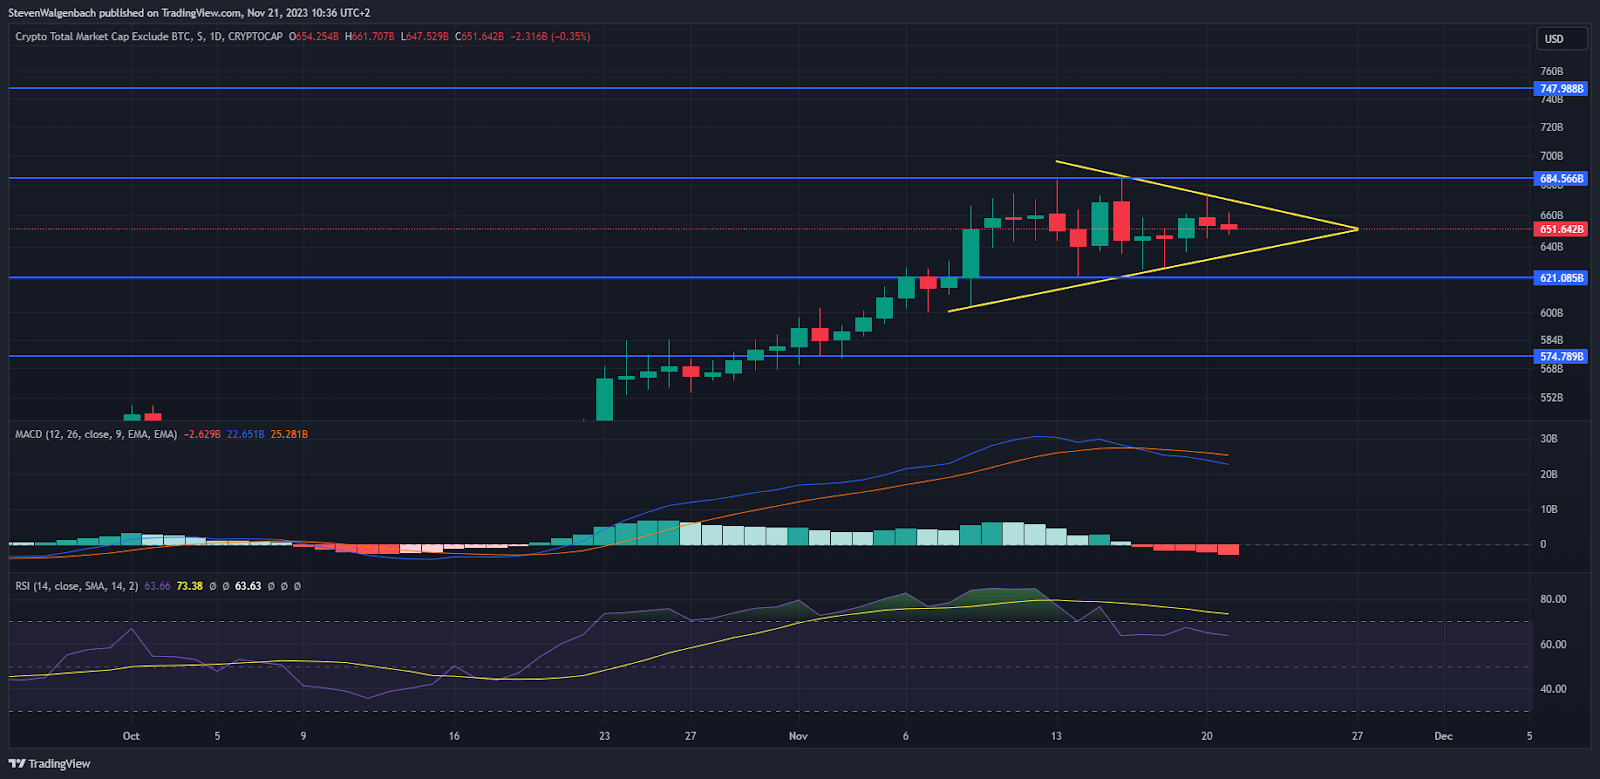
If the altcoin market cap breaks upwards over the next few days, it will attempt to turn the resistance level into support at $684.566 billion. Going forward, a daily candle close above this level could create room to push the market’s valuation up to $747.988 billion in the short term.
This bullish forecast will likely be invalidated if TOTAL2 falls below the triangle chart formation appearing on its daily chart. A daily candle close below the formation will lead the altcoin market capitalization to retest the key support level of $621.085 billion in the next 48-72 hours.
If sellers continue to put pressure on altcoins, the valuation could drop to as low as $574.789 billion. Traders should take into account that technical indicators on TOTAL2’s daily chart indicate that the momentum is in favor of the sellers.
As Koinfinans.com reported, the MACD line was below the MACD Signal line. This can also be interpreted as a sign that TOTAL2’s negative trend may continue in the next few days.
In addition, the daily Relative Strength Index (RSI) line is positioned below the RSI Simple Moving Average (SMA) line. Normally this indicates that the sellers have more power than the bulls. This means that right now it is easier for sellers to push TOTAL2 down than for bulls to push it up.