
According to analyst Rakesh Upadhyay, Bitcoin price may gain momentum above $56,100 and this move may attract purchases in DOT, UNI, LINK and XMR. Before moving on to detailed altcoin technical analysis, we start with the developments from the market.
What happened in Bitcoin and altcoin projects?
Bitcoin price is trading above $57,000 and the sharp rise has increased its dominance from 40.70% on September 12 to nearly 45% on October 11. This suggests that the strong recovery in the cryptocurrency market is primarily driven by Bitcoin. On the other hand, the Fear and Greed indicator has reached the Greed zone. While this indicates that the markets may have risen quickly in a short period of time, it does not necessarily indicate a confirmed short-term top. Historical data suggests that investors who only sold their Bitcoin positions on this metric, as analyst Marcel Pechman highlighted, may have missed out on strong gains before the correction was made.
Now, can the bulls extend the upward move and push the price closer to the ATH level in Bitcoin? If that happens, selected altcoin projects could move upwards, according to analyst Rakesh Upadhyay. We continue with the technical analysis of the five cryptocurrencies that can remain strong in the short term…
Bitcoin technical analysis
Bitcoin broke above the tough overhead resistance at $52,920 on Oct. 6, and the bulls have since held its price above the breakout level. This is a positive sign, as it indicates that buyers may be holding their positions pending higher levels in the short term. On the technical side, the MAs have completed a bullish crossover and the RSI is close to the overbought zone, indicating the path of least resistance to the upside. If buyers push the price above $56,100, the uptrend could continue and BTC could rally to $60,000. Above this level, a retest of the ATH level of $64,854 is possible. Contrary to this assumption, if the bears pull the price below $52,920, BTC price could drop to the 20-day EMA ($49,504). This is an important support for the bulls’ defense as a break below this could signal a change in short-term sentiment. BTC could then drop to the 50-day SMA ($47,578) and near $40,000.

The bulls are facing selling in the $55,750 to $56,100 region but a positive sign is that buyers are not allowing the price to drop below the 20-day EMA. This indicates that the bulls are waiting for a break above the top zone. If this happens, Bitcoin could resume its uptrend against the dollar. The first sign of weakness would be a break and close below the 20-day EMA. The RSI is forming a negative divergence, signaling that momentum may weaken. A break and close below the 20-day EMA could push the price towards the 50-day SMA. A break below this support could initiate a deeper correction.


Polkadot (DOT) technical analysis
Polkadot (DOT) is gradually rising towards the overhead resistance at $38.77. The RSI broke the downtrend line and the 20-day EMA ($32.15) started to rise, indicating an advantage for buyers. If the bulls push the price above $38.77, it will invalidate the head and shoulders pattern. The failure of a bearish pattern is a bullish sign as it can trap aggressive bears who are trying to hold their positions later, resulting in a short squeeze. The DOT could then start its journey towards $49.78. Alternatively, DOT price could drop to $28.60 if the price breaks from the current level or overhead resistance and dives below the MAs. A bounce from this support could keep DOT/USDT range-bound for a few days. The bears will have to push the price below the neckline to show their dominance.

On the technical side, both MAs are rising and the RSI is in the positive territory, indicating that the buyers are in control. The pair could drop to the 20-day EMA, which is likely to act as a strong support. If the price breaks out of this support, the bulls will attempt to push the pair to $38.77. This level could act as a stiff resistance again, but if the bulls don’t give up too much of it, a break above it is more likely. Conversely, if the bears pull the price below the 20-day EMA, the pair could drop to the 50-day SMA. A break and close below this support could result in a drop to $31 and then to $29.

These levels await altcoin UNI bulls
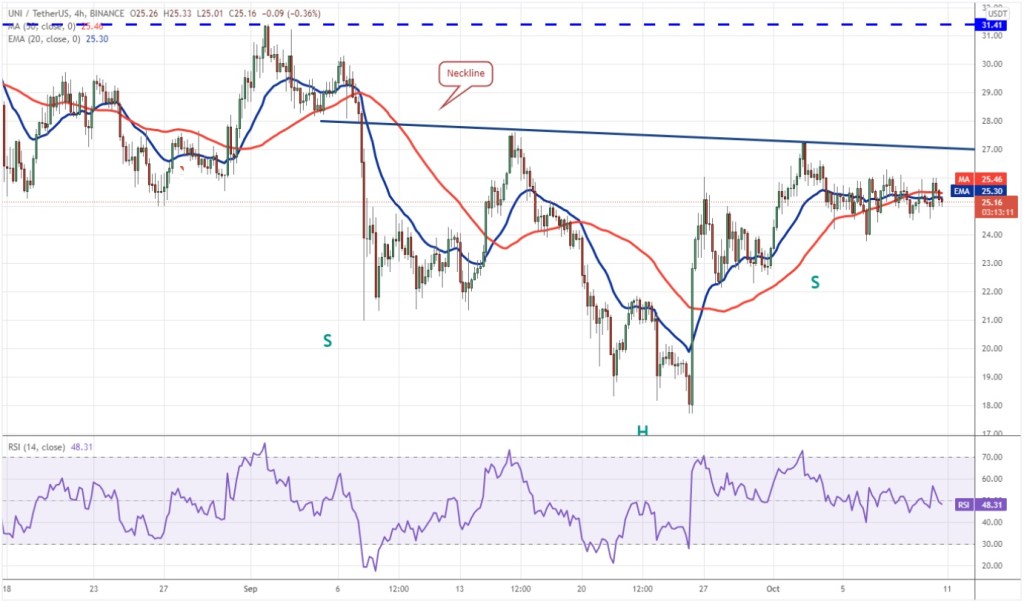
Uniswap (UNI) has been holding above the 20-day EMA ($24.55) for the past few days, indicating that the bulls are trying to defend this support. However, the bears are not in the mood to give up as they do not allow the price to rise above the neckline. Buyers will have to push the price above the neckline to complete an inverted head-and-shoulder pattern. This bullish reversal setup has a formation target at $36.98, but the rally may not be linear as the bears will try to defend the level at $31.41. On the technical side, the 20-day EMA is gradually rising and the RSI is just above the midpoint, which indicates that the bulls have a slight edge. This advantage is lost if the price breaks and falls below the 20-day EMA. In such a case, the UNI price may drop to $22. This level could act as a support, but if the bears sink the price below it, the pair could extend the decline to $17.73.

The 4-hour chart shows that the price has been consolidating roughly in a tight range between $24 and $26 for some time. Usually, such narrow gaps cause a directional movement to begin. If buyers hold and sustain the price above $26, the probability of a break above the neckline increases. This could start the march towards the next overhead resistance at $30 and then at $31. On the other hand, if the price drops below $24, the short-term trend could turn in favor of the bears. The pair could drop to $22 later.
Altcoin Chainlink (LINK) bulls have 2 targets over $30
Chainlink (LINK) broke above the downtrend line on October 1, but the bulls failed to capitalize on this move. The altcoin has been stuck in a tight range between $25.20 and $26.19 for the past few days. On the technical side, both MAs are flat and the RSI is trading just above the midpoint, indicating a balance between supply and demand. This balance will turn in buyers’ favor if the price breaks and closes above $28.19. LINK could then rally to $32.11 and then challenge the stiff overhead resistance at $35.33. Alternatively, a break and close below $25.20 could indicate that supply is outpacing demand. LINK could then decline to the $22 to $20.82 support zone.

The price fell from the overhead resistance and the bears pulled the price below the MAs. If the sellers sustain lower levels, LINK could drop to support at $25.20. A break below this level could indicate that the bears are in command again. Conversely, if the price rises from the current level and rises above the MAs, it indicates that traders are buying on the dips. The bulls will have to push and sustain the price above $28.19 to signal their return to the driver’s seat. Then LINK can rise to $32.11.

These hurdles await XMR bulls in the BTC upswing!
Monero (XMR) rallied above the 50-day SMA ($271) on October 5 and hit the downtrend line on October 6. The bulls allowed the price to slide below the 50-day SMA. On the technical side, the 20-day EMA ($263) is gradually rising and the RSI is in the positive territory, indicating a small advantage for buyers. A break and close above the psychological mark at $300 might open the doors for an upward move to $325 and then $339.70. On the contrary, if the price drops and dips below the 20-day EMA, it suggests that short-term traders may have abandoned their positions. This could push the price down to $250 and then $225.
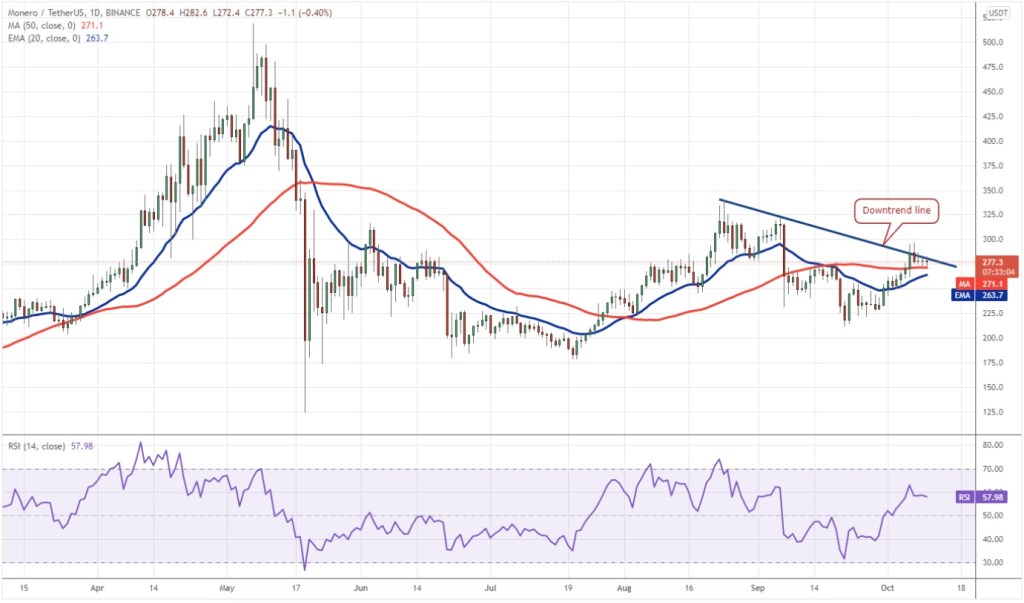
Now the bulls repeatedly pushed the price above the downtrend line but the bears did not let the pair stay above it. The 20-day EMA has flattened out and the RSI is near the centre, suggesting a balance between supply and demand. If the price breaks below the 50-day SMA, the short-term bulls could rush to the exit. This could push the price towards $260 and near $250. Conversely, if the bulls push the price above $286.8, the pair could rally to $296.80. The bullish momentum could increase if the bulls price rises above this resistance.

Contact us to be instantly informed about the last minute developments. twitter‘in, Facebookin and InstagramFollow and Telegram and YouTube join our channel!

Disclaimer: The articles and articles on Kriptokoin.com do not constitute investment advice. Cryptokoin.com does not recommend buying or selling any cryptocurrencies or digital assets, nor is Kriptokoin.com an investment advisor. For this reason, Kriptokoin.com and the authors of the articles on the site cannot be held responsible for your investment decisions. Readers should do their own research before taking any action regarding the company, asset or service in this article.
Warning: Citing the news content of Kriptokoin.com and quoting by giving a link is subject to the permission of Kriptokoin.com. No content on the site can be copied, reproduced or published on any platform without permission. Legal action will be taken against those who use the code, design, text, graphics and all other content of Kriptokoin.com in violation of intellectual property law and relevant legislation.