
Popular altcoin Litecoin Its price has decreased since July 2023. However, this week it has returned to a long-term support level.
The price jumped yesterday, creating a bullish candlestick on the daily timeframe.
Litecoin Returns to Support
Technical analysis on a weekly time frame shows that the LTC price has been falling since reaching $115 in July 2023. This decrease decreased to 56 dollars in August.
After a brief bounce and subsequent decline, LTC price formed a higher low last week (green icon).
altcoin The jump in price confirmed the long-term ascending support trend line that has existed since June 2022 and a horizontal area that has intermittently acted as both support and resistance.
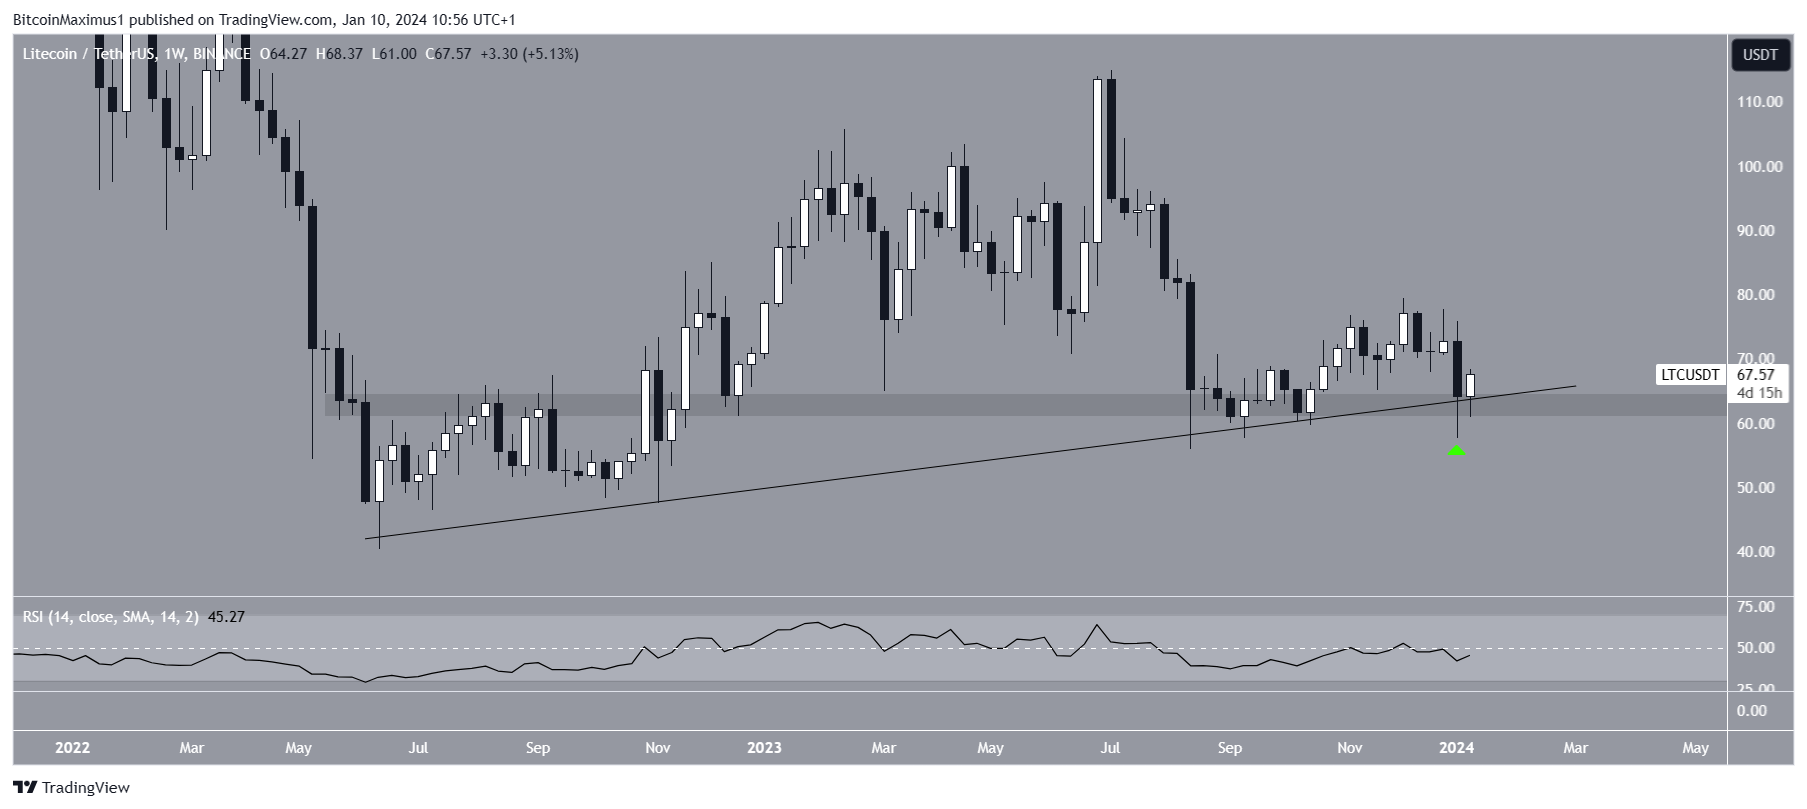
Traders use the RSI as a momentum indicator to evaluate whether a market is overbought or oversold and whether an asset should be accumulated or sold.
If the RSI value is above 50 and the trend is upward, the bulls still have the advantage. However, if the value is below 50, the opposite is true. The weekly RSI value is at 50, which is a sign of an uncertain trend.
What Do Analysts Say?
Cryptocurrency traders and analysts at X have a mixed view on the future LTC price trend.
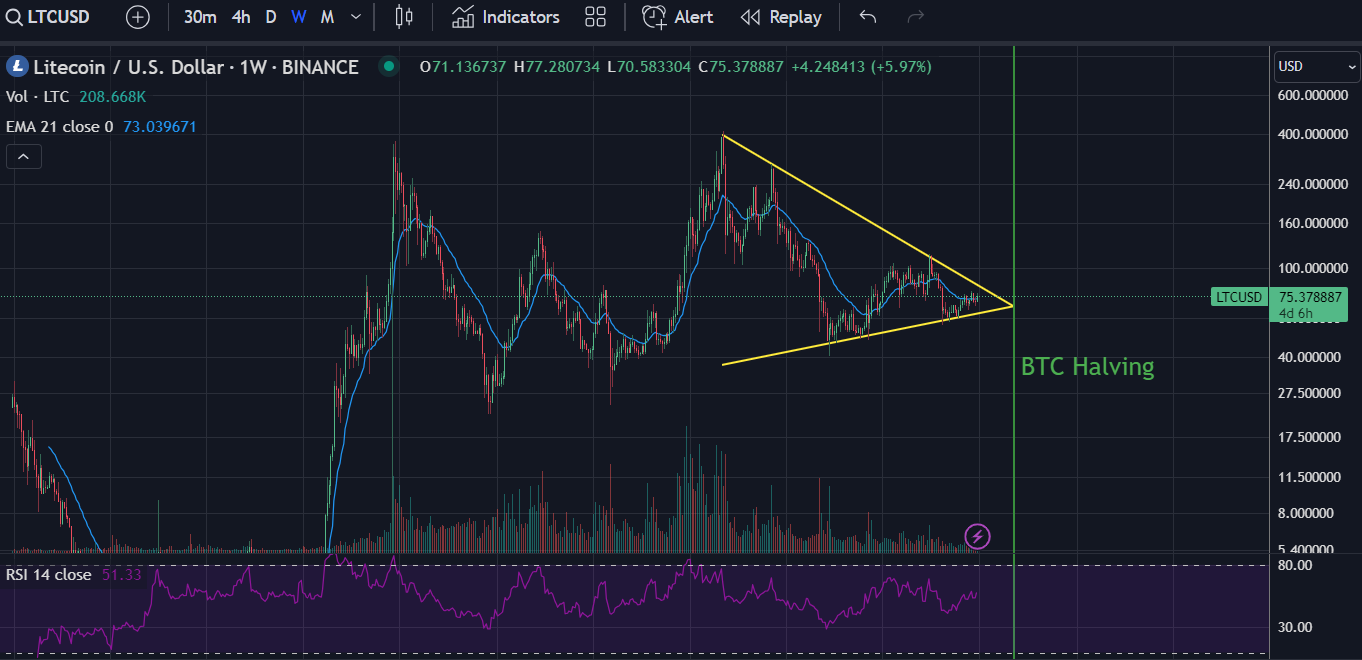
Joao Devesa believes that the LTC price will rise significantly soon due to a potential breakout from a long-term formation.
However, Diamond Hands is in a downward trend. He pointed out two ascending parallel channels, whose breakouts are likely to trigger downward moves.
LTC Price Forecast: Further Decline or Trend Reversal?
Similar to the weekly time frame, the 2-day chart also does not confirm the direction of the trend. However, the wave number tends to increase. Elliott Wave theory involves analysis of recurring long-term price patterns and investor psychology to determine the direction of a trend.
The most likely wave count shows the price completing a five-wave upward move and an ABC corrective structure that started in June 2022.
If so, Litecoin has initiated another upward move (white) in September 2023. If these uptrends remain the same length, LTC will rise 80% and reach the next resistance at $122.
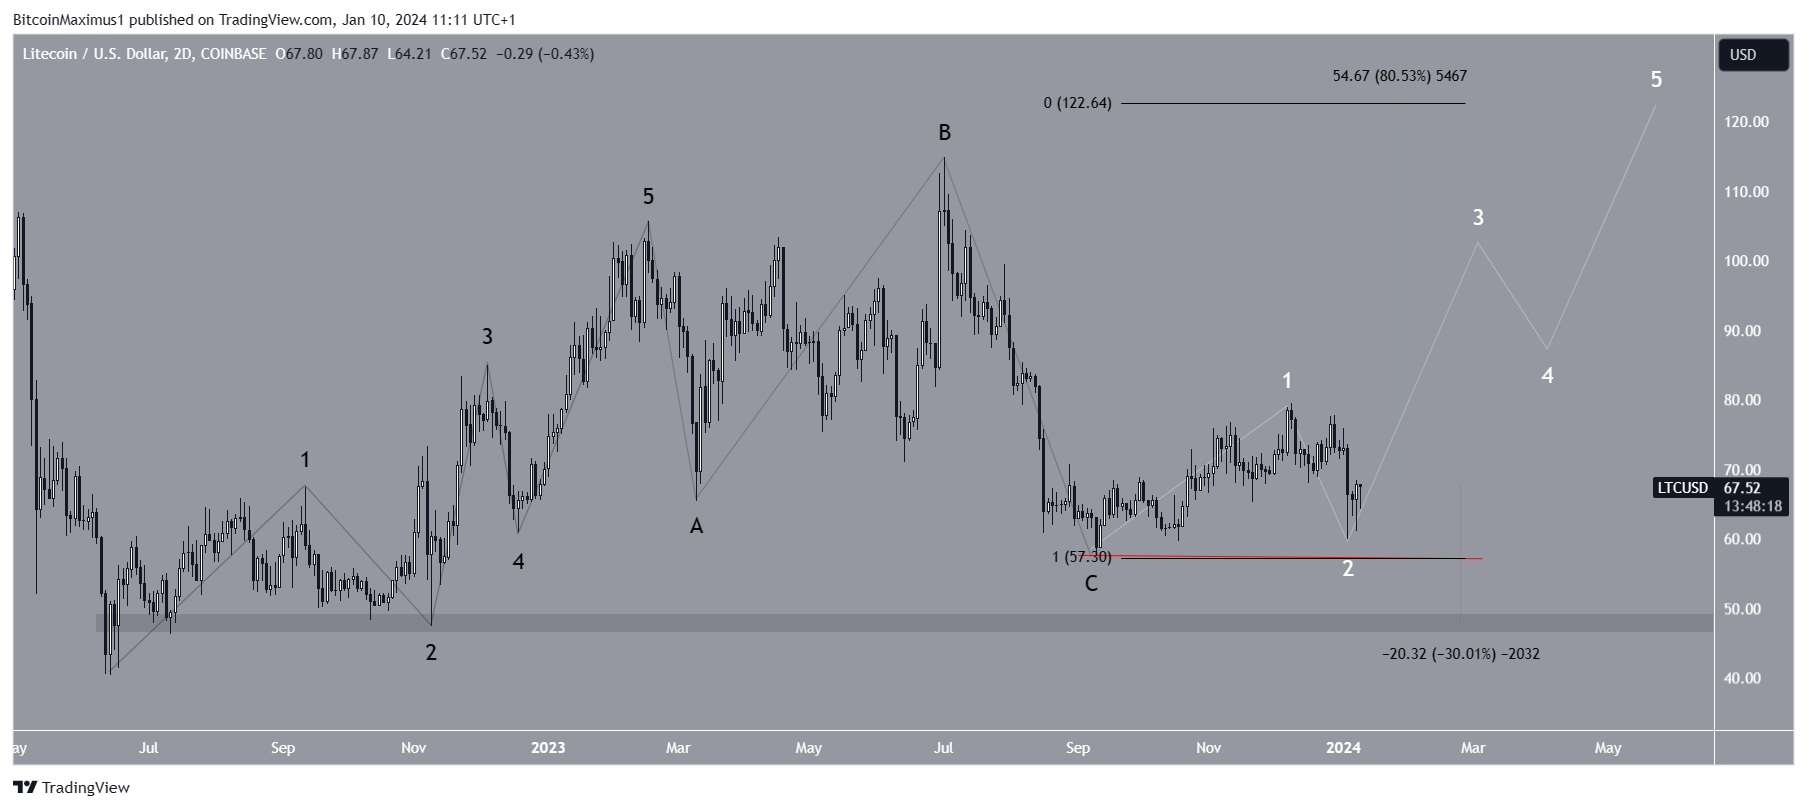
Despite this bullish LTC price prediction, a drop below the September 2023 low of $57.30 (red) would invalidate the bullish count. Then, LTC could decline by 30% to the nearest support at $48.