
Indicators revealed that the Bitcoin (BTC) rally in 2019 is similar to the current rise.
According to on-chain data, the rise of Bitcoin in 2019 and the rise since the beginning of 2023 show similarities in many points. However, there are four strong reasons that point to a major turning point where the market could either turn into a full-fledged bull market or revert to a long-term bearish trend. According to the rally duration, experts say that this rise may continue until June.
1- MA200 resistor
When an analysis of the current period of the Bitcoin price is made over the 2019 data, the first indicator that draws attention is the price. daily MA200 resistance its relationship with. of bitcoin $19,600 With the breaking of the level, this important resistance was overcome and investors strengthened their upside expectations. When the mentioned MA200 resistance is exceeded in 2019 8-9 thousand dollars BTC positioned in the band from that point 60 thousand dollars It had a bull season up to the level.
2- Rally time
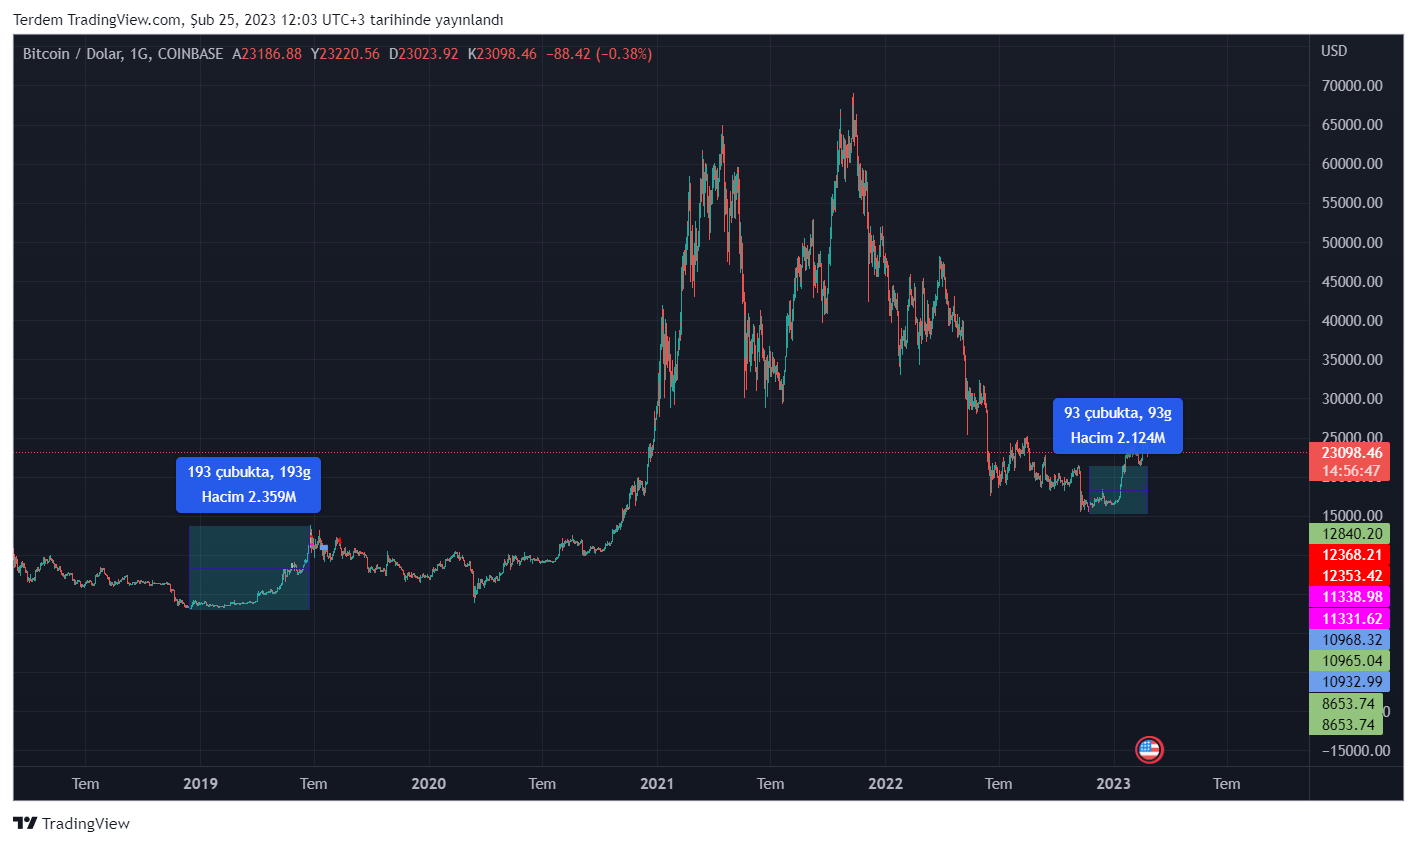
When examined in terms of time, the rise period in 2019 while it lasted 193 daysBitcoin, from the bottom on November 9 to this day 93 days have passed visible. This leads analysts to think that the current uptrend is only halfway through. If this rally will last as long as in 2019, June It is expected that the upward trend will continue until the next month.
3- SSR data is at its peak
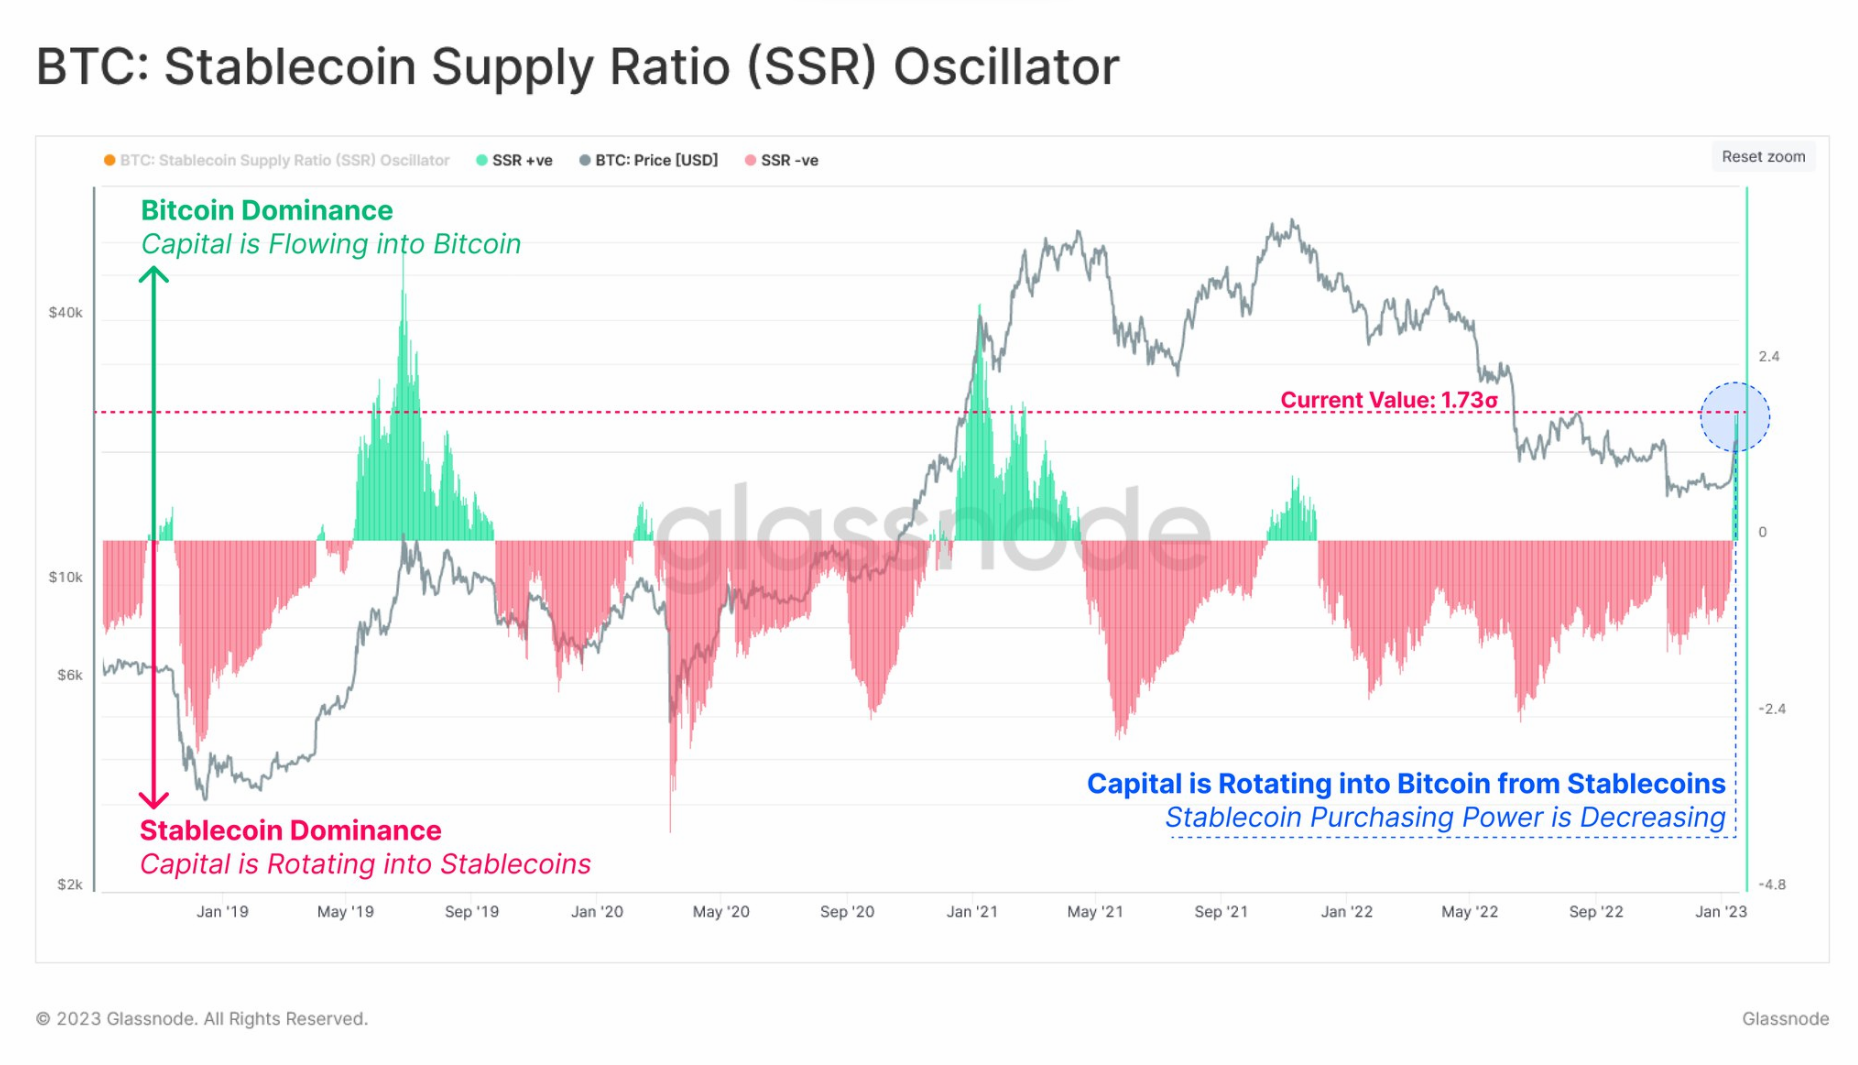
Bitcoin stablecoin supply rate (SSR), which is defined as an important indicator without measuring the purchasing power of the market As high as at 2019 peak prices. The increase in this metric indicates a weakening in the purchasing power of stablecoins. Having previously turned green in 2019 and 2021, the SSR data, which confirmed the rise, turned green in this rise in 2023. However, in 2019 and 2021, given that the SSR correctly marks the price peak, the data should be followed closely and a possible reversal signal should not be overlooked.
4- SOPR data could be a confirmation for the uptrend
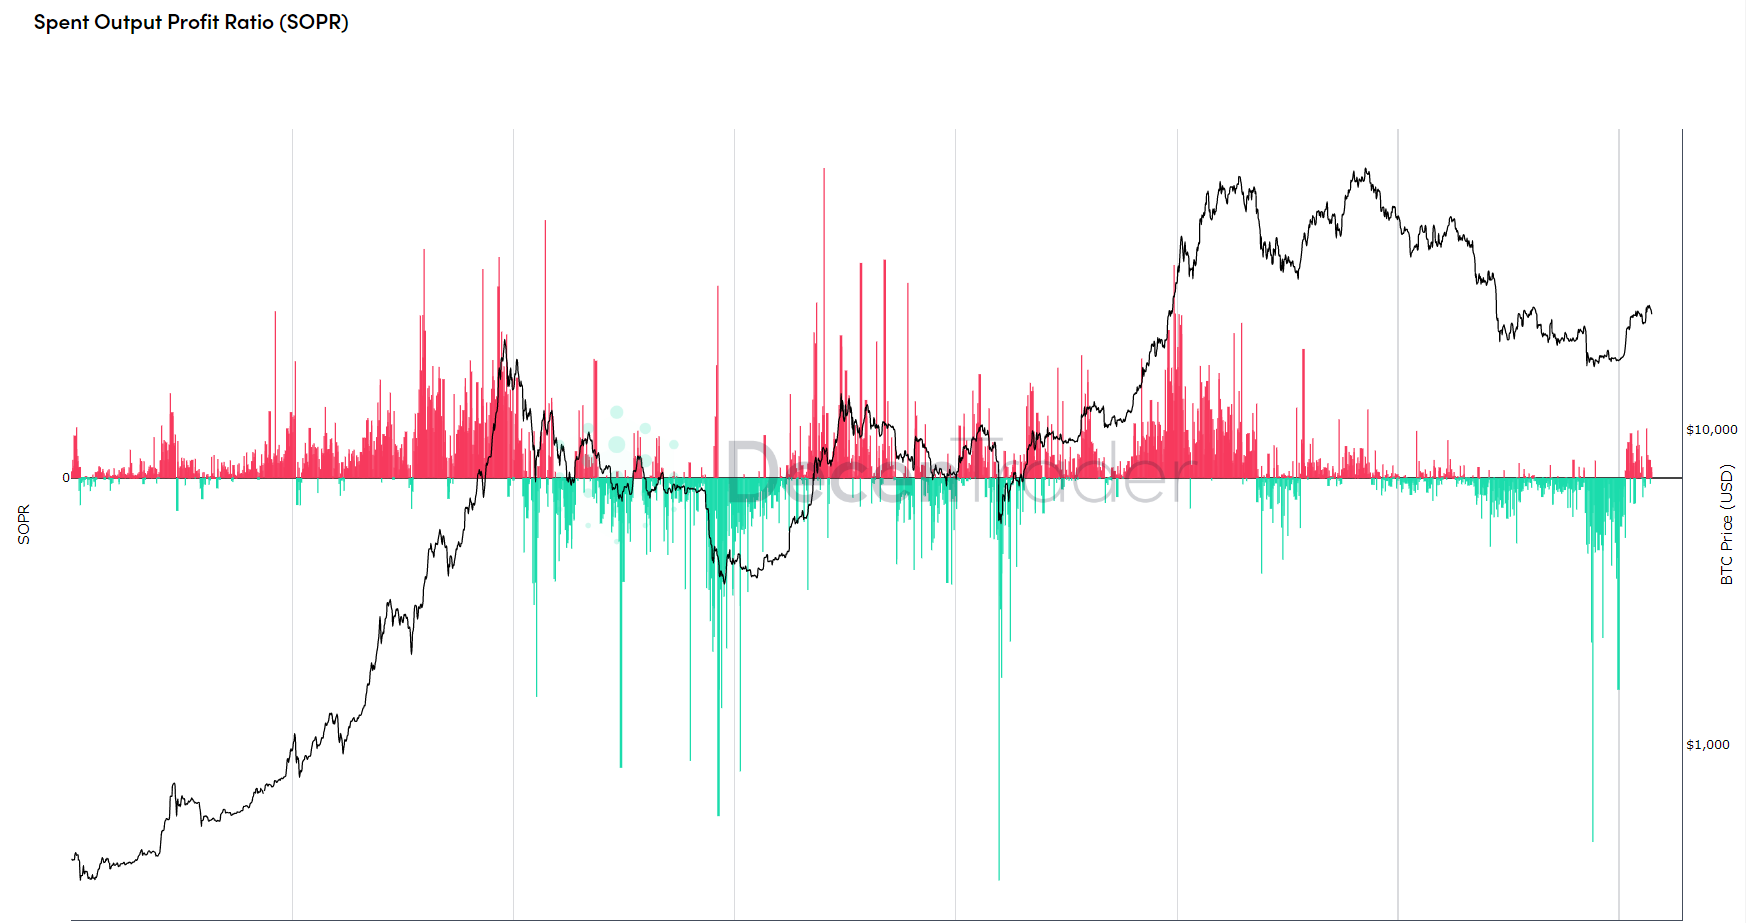
According to data from Decentrader, the 7-day moving average of the SOPR indicator shows that the bear trend is likely to reverse. Indicator, Bitcoin in January 2023 your $20,800 when it went up, it went up. Metric, price of Bitcoin $21,800 retested significant support level while an uptrend made it a very important level of support for
Similarly, the price has broken above the average buying levels of both short-term and long-term holders, which is another signal of a potential trend reversal. This means that the market’s oscillators return to equilibrium. You have reached an important turning point. It could be a sign.