

Stellar (XLM) The price readings on the long and short-term price chart indicate a bearish before the uptrend reverses.
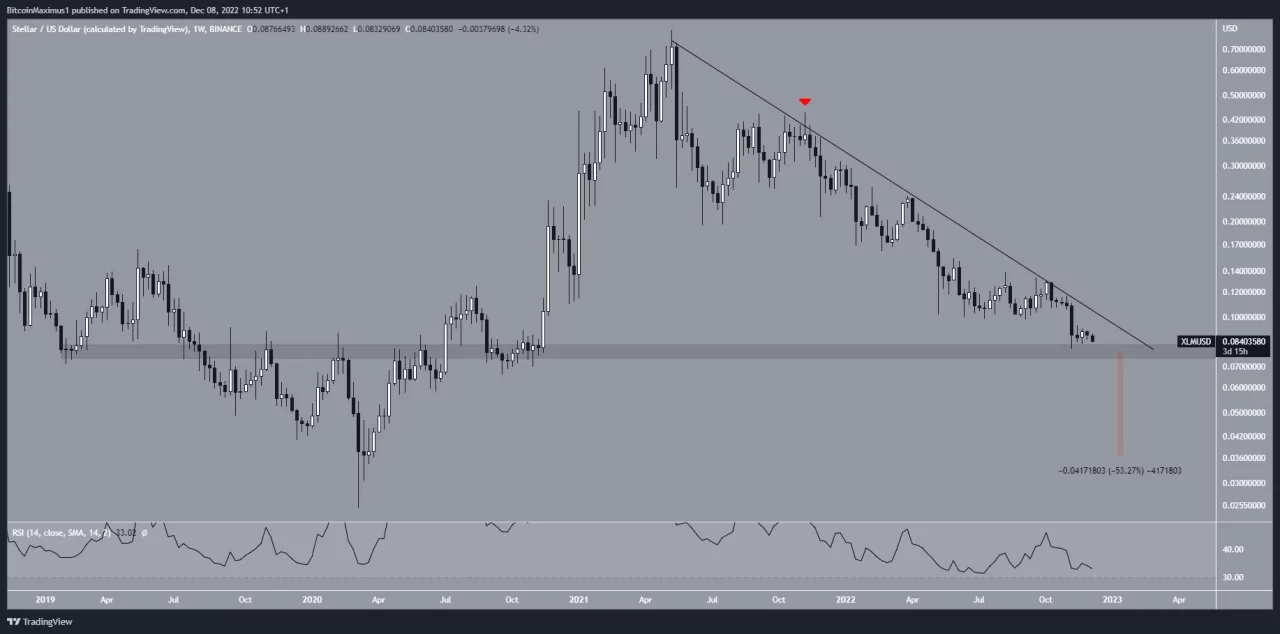
The technical analysis of the weekly chart, on the other hand, shows that a bearish trend will emerge. XLM price entered a downtrend after hitting the $0.80 high in May 2021. This resulting downward move created an even lower ‘top price’ in November. This level is indicated by the ‘red icon’ on the chart.

As a matter of fact, XLM price so far has recorded a low of $0.079 last month. Following a weak bounce, the price again approached the $0.079 level.
The relative strength index (RSI) is also down on the week, showing no signs of bullishness. As a result, the Stellar (XLM) price prediction suggests that a drop to the $0.078 support level is possible.
The $0.078 area represents the support area before the March 2020 low. That’s why keeping support here is critical. Otherwise, a break below this level will trigger a sharp decline.
As a result, a drop in Stellar price from the $0.078 support area or break out of the resistance line will likely determine the future trend.
Stellar (XLM) Price Chart Shows Bearish Pattern
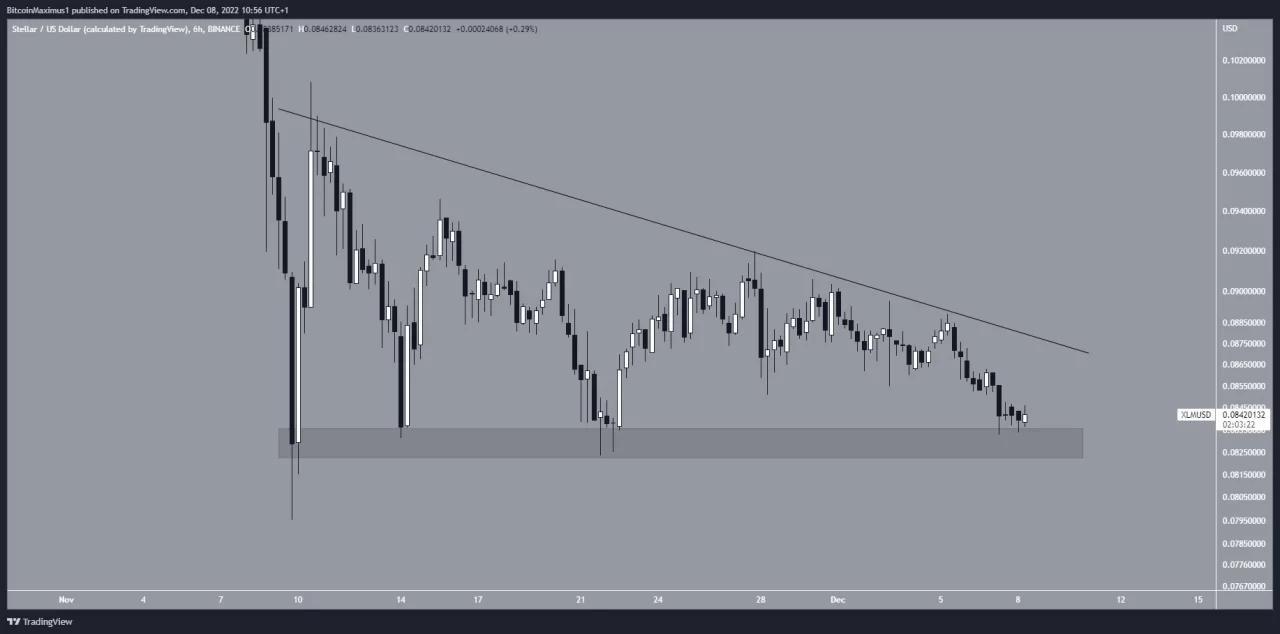
XLM is also showing a bearish outlook on the six-hour short-term chart. This is because Stellar price is trading inside a descending triangle, which is considered a bearish pattern. The support of the triangle is at $0.083.
Breaking this level will confirm the pattern and likely result in a drop in XLM price to the long-term $0.078 support area.
Koinfinans.com As we have reported, a break in the short-term resistance line will invalidate the bearish forecast.
There Are Different Factors Supporting The Decline
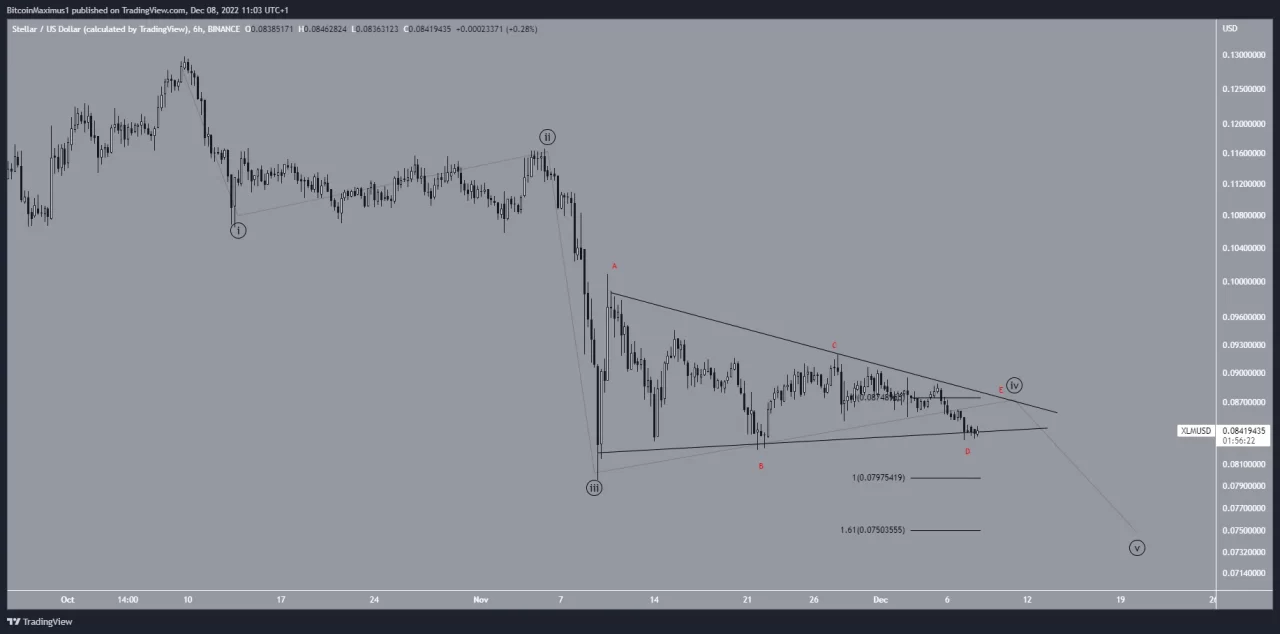
As a result, the wave count model also offered a bearish forecast. As measured from Oct. 9, XLM price appears to be stuck in a ‘five-wave’ bearish outlook.
If this view is correct, it is possible to say that it is currently in the ‘fourth wave’, which takes the form of a triangle. The lower wave number is shown in red on the graph.
If the predictions are correct, Stellar price will follow the triangle after a short-term rise and fall and complete the correction.
The Fibonacci retracement in the fourth wave predicts a price target of $0.075, which is very close to the long-term $0.078 horizontal support area.
As a result, this bearish wave count will be invalidated if the price breaks above wave C high of $0.091.
You can follow the current price action here.
Disclaimer: What is written here is not investment advice. Cryptocurrency investments are high-risk investments. Every investment decision is under the individual’s own responsibility. Finally, Koinfinans and the author of this content cannot be held responsible for personal investment decisions.