
Surprisingly, Solana (SOL) experienced a significant increase in price, breaking previous patterns and reaching a yearly high. As of December 23, SOL broke through the $100 price zone, causing the cryptocurrency community to speculate on the sustainability of this uptrend. This article discusses the key factors driving Solana’s rise, its market position, and investors’ reactions to this unexpected price increase.
SOL price started to rise
Experts’ analysis of Solana’s daily price trend reveals a consistent upward trend over the past five days. The chart peaked in the $100 price range on December 23 and showed no signs of stopping at the time of this report. From the uptrend on December 20th until the news was published, SOL saw a growth of approximately 65% and traded at around $115, reflecting a significant increase of over 7%. This marks the first time SOL has reached such a price level since 2022 and is supported by the bullish trend shown by the Relative Strength Index (RSI) crossing 80.
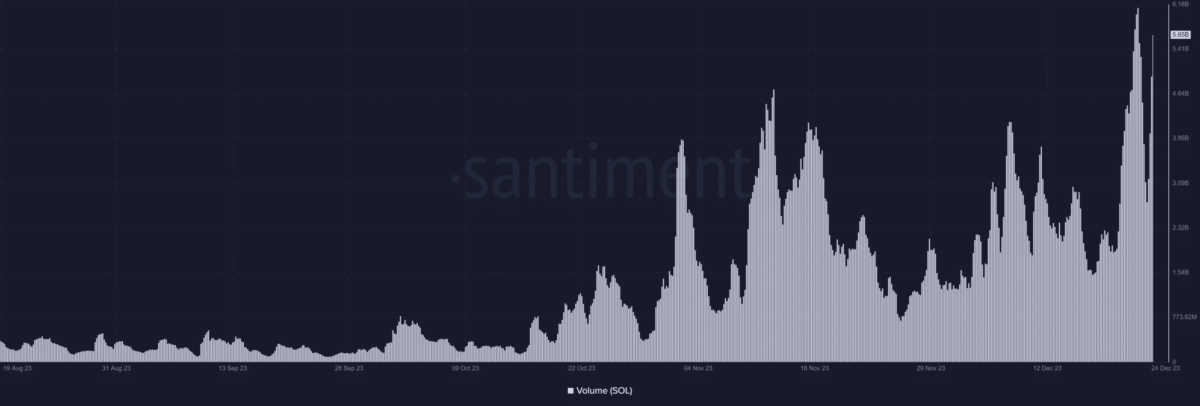
Examining the volume chart on Santiment shows that there has been a significant increase in Solana’s transaction volume, exceeding $5 billion and maintaining strong momentum. Data from CoinMarketCap reveals an 18% increase in volume in the last 24 hours, pushing Solana’s market cap to over $48.7 billion, solidifying its position as the fourth largest asset. The reports also examine Solana’s impressive annual performance, which saw its price increase by over 800%.
Large liquidations on short positions
Despite signs of a possible shift in the price range, some traders chose to open short positions against Solana. However, data from Coinglass shows that short positions suffered significant losses during the recent price increase. Short liquidations reached nearly $14.3 million on December 23, dwarfing long liquidations of around $3.7 million. This marked the highest short liquidation observed in more than three months, highlighting the difficulties faced by those expecting a price decline.
Solana’s recent rise has not only attracted the attention of investors but also strengthened its position in the cryptocurrency market. With its strong market cap, rising trading volumes, and short positions facing serious liquidations, Solana’s trajectory raises questions regarding its potential dominance in the crypto space. While the crypto community is monitoring the price dynamics of Solana, we do not yet know whether this uptrend will be a temporary uptrend or the beginning of a permanent uptrend.
What’s next for MATIC and FTM?
On the other hand, cryptocurrency analyst and trader Ali Martinez provides information about the price movements of Fantom (FTM) and Polygon (MATIC), highlighting the potential course of both crypto assets. In the case of Phantom, recent double-digit gains have pushed the token above $0.47; Trading volume increased by 116% to $337 million and futures open interest increased by 25% to $123.6 million. If FTM holds itself above the critical support level at $0.47, Martinez predicts a potential upside of around 35% to $0.65. The analysis takes investor sentiment into account, with data from IntoTheBlock showing that the majority of investors are in profitable positions with FTM.
In contrast, Polygon (MATIC) faces a tough resistance zone between $0.79 and $0.84, where approximately 39,000 addresses hold over 4.24 billion MATIC. Breaking this resistance is crucial for MATIC to start an upward trend. Despite this hurdle, MATIC is trading at $0.855, reflecting a 7% increase in the last 24 hours. Martinez’s analysis offers valuable insight into the potential movements of these cryptocurrencies as investors closely monitor developments for potential trading opportunities in the dynamic cryptocurrency market.
Arbitrum also attracts attention
Meanwhile, according to experts, Arbitrum (ARB) price has formed a long-term upward pattern. The completion of the formation is expected to accelerate the upward momentum. Arbitrum (ARB) price has been forming an inverse head and shoulders pattern since May 2023. This is a bullish pattern and in most cases leads to breakouts. In fact, the ARB price is attempting to break above the neckline of the formation this week after forming the right shoulder bottom during the week of November 20-26.

While Solana continues to rise to a yearly high, the broader cryptocurrency market is witnessing different trajectories for altcoins such as Fantom and Polygon. While Phantom is showing promising signs of further growth and overcoming challenges, Polygon is grappling with a significant area of resistance. Investors and enthusiasts are driving these dynamics by seizing potential trading opportunities in the ever-evolving landscape of the cryptocurrency market.
To be informed about the latest developments, follow us Twitter’in, Facebookin and InstagramFollow on . Telegram And YouTube Join our channel.