
Although the leading crypto Bitcoin managed to stay above $ 30 thousand, it lacks any upward momentum. However, Santiment data shows that whales are accumulating BTC. What awaits Bitcoin in an environment of uncertainty? Analysts and experts share their forecasts.
Bitcoin whales accumulating, will the price rise?
cryptocoin.comAs you follow, last week, Bitcoin (BTC) rose as high as $ 31,000. In this process, it reached a new peak for 2023. On-chain data shows that Bitcoin whales continue to accumulate at every point during the recent price rally. Addresses holding 10 to 10,000 Bitcoins have accumulated 71,000 BTC over the past three weeks, according to Santiment data. The data provider noted:
Bitcoin sharks and whales are showing no signs of slowing down, even as prices start to get “boring” in the $30,000 to $31,000 range. Since June 17, 10 to 10 thousand BTC addresses have accumulated another 71 thousand coins, which equates to $2.15 billion.
However, after hitting $31,000 last Monday, Bitcoin continued to face selling pressure. Thus, it declined towards $30,000. But another positive on-chain indicator for Bitcoin was the drop in the BTC exchange reserve metric last month. This indicates an upward trend among market participants.

Standard Chartered raises Bitcoin forecast: $120,000
Standard Chartered stated on Monday that the value of Bitcoin could reach $50,000 this year and $120,000 by the end of 2024. Accordingly, he predicts that the recent jump in its price will encourage Bitcoin “miners” to hoard more of the supply. Standard Chartered released a $100,000 end of 2024 forecast for Bitcoin in April, with the view that the “crypto winter” is over. But Geoff Kendrick, one of the bank’s top currency analysts, said that now that estimate has been revised “upward” by 20%. Kendrick underlined the following in a report:
Increased miner profitability per BTC mined means they can sell less, reduce the net supply of BTC, and raise BTC prices while maintaining their cash inflows.
BTC price showing bearish signs!
Analyst Aayush Jindal evaluates the technical picture of BTC. Bitcoin price moved into the red zone after breaking the $30,500 support zone. BTC traded below the $30,000 level but the downside was limited. The price seems to be trading in a range above the $29,850 support zone. There was a move from the 23.6% Fib retracement level on the downside from the $31,630 high to $29,868 high. The price even tried a fresh increase above the $30,500 resistance but failed.
Bitcoin is currently trading below $30,500 and the 100 hourly simple moving average. There was also a break below a contracting triangle with support near $30,200 on the hourly chart of the BTC/USD pair. If there is another increase, the price could face resistance near the $30,300 level and the 100 hourly simple moving average. The next resistance is near the $30,500 area, where the price could retest $30,750. This is near the 50% Fib retracement level of the downside move from the $31,630 high to $29,868 high.

If the bulls propel the price above the $30,750 level, a slide towards $31,000 is possible. The next major resistance is near the $31,400 level. More strength is likely to open the doors for a move towards the $32,000 resistance zone.
‘Explosive’ and risky developments are coming for Bitcoin!
The analyst, nicknamed DonAlt, warns that Bitcoin could witness a sell-off in the midst of a long consolidation at the $30,000 level. The analyst says that Bitcoin is struggling to rise above an important psychological level. Therefore, he states that he is facing more than one wind. According to DonAlt, Bitcoin’s momentum seems to have waned with the S&P 500 reaching a significant level of resistance and Binance executives leaving the world’s largest crypto exchange due to the ongoing US Department of Justice (DOJ) investigation.
The analyst says that he is starting to be cautious about BTC. However, he states that he is still bullish on Bitcoin. He also highlights that any drop will be an opportunity to accumulate more Bitcoin. In this context, the analyst makes the following statement:
But it’s just apparently, you’re looking at the weekly (chart), and it’s not a bad chart. So I wouldn’t say to people, ‘Hey, this is where you’re short selling and your target is $24,000 or whatever. I’m not really in that camp. If anything, if we go low, you want to buy this. And if we go up, you want to buy the first pullback. That’s why I’m still in the bull squad. But between $30,000 and $32,000 I think it makes sense to be a little cautious.

Mike Novogratz calls to buy BTC!
Famed billionaire, rader and crypto pro Mike Novogratz has issued a fiery call to action urging investors to consider buying Bitcoin after a shocking announcement regarding the rising US national debt. The announcement comes after chief market strategist Charlie Bilello said the national debt has increased by a staggering $1 trillion since the debt ceiling was suspended last month.
Novogratz, a prominent figure in the crypto community, expressed his dismay at the alarming rise in debt, calling it “crazy.” In turn, he advised his followers to explore the potential of BTC as a hedge against the depreciation of the US dollar, which is largely attributed to the government’s broad monetary policies.
Will Bitcoin sink or float?
Analyst Valdrin Tahiri draws the technical picture of BTC as follows. On the daily timeframe, BTC hit a year high at $31,500 on July 6. However, it crashed soon after. It created a shooting star candlestick on the same day. Moreover, the candlestick caused BTC price to close below the $31,500 horizontal resistance area. This is another bearish sign that further legitimizes the shooting star candlestick.
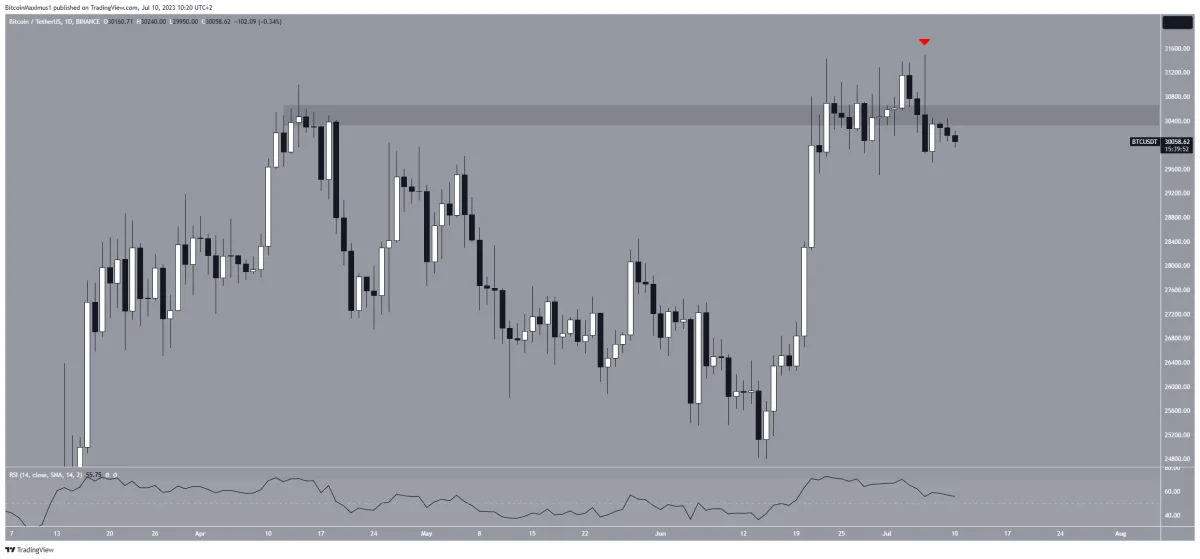
However, the daily RSI is giving a mixed reading. While the RSI is falling, it is still above 50. Thus, the indicator provides a contradictory view.
A more detailed analysis of the six-hour short-term timeframe reveals a long-term bullish outlook but a short-term bearish outlook. This is mostly due to the number of waves. The wave count shows that BTC price has completed a five-wave bullish move that started on June 15. If so, the move has been corrective since the first high on June 13. The fact that the price action is located within a parallel channel supports this possibility.
Therefore, if the count is correct, BTC price will break out of the channel and drop to the 0.382 Fib retracement level of $28,900 or even the 0.5 Fib retracement level of $28,150. Then, a continuation of the previous long-term upward move is possible. Finally, the six-hour RSI supports the possibility of a breakdown. The indicator is declining and below 50, both signs of a downtrend.
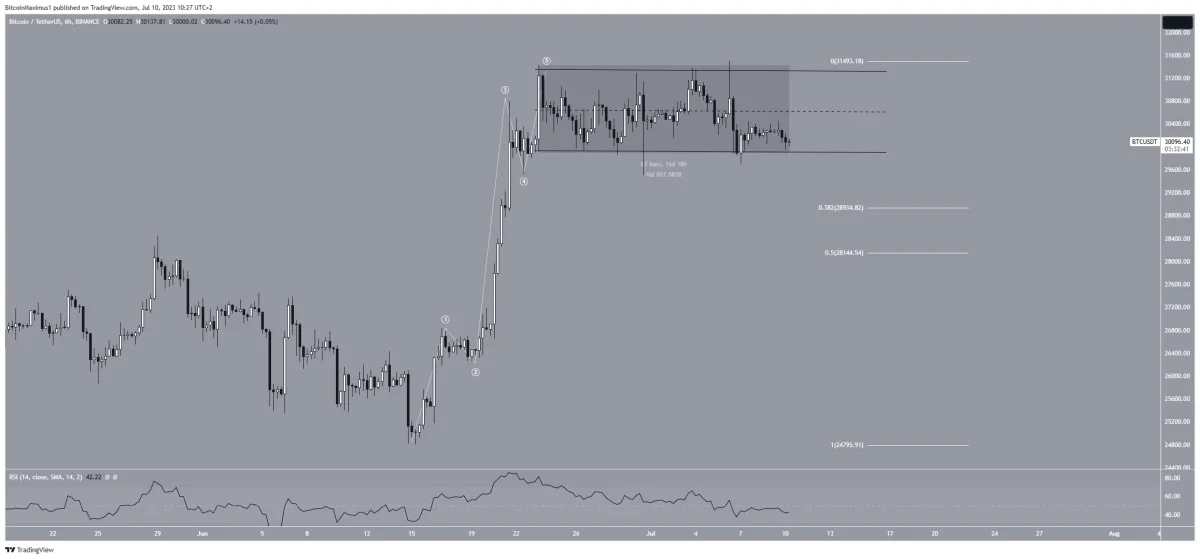
Despite this bearish short-term BTC price prediction, breaking above the fifth wave high of $31,500 will mean the correction is complete and the trend is up. In this case, BTC price will likely break out of the channel and rise to the next resistance at $36,000.
Contact us to be instantly informed about the last minute developments. twitter‘in, Facebookin and InstagramFollow and Telegram And YouTube join our channel!
Risk Disclosure: The articles and articles on Kriptokoin.com do not constitute investment advice. Bitcoin and cryptocurrencies are high-risk assets, and you should do your due diligence and do your own research before investing in these currencies. You can lose some or all of your money by investing in Bitcoin and cryptocurrencies. Remember that your transfers and transactions are at your own risk and any losses that may occur are your responsibility. Cryptokoin.com does not recommend buying or selling any cryptocurrencies or digital assets, nor is Kriptokoin.com an investment advisor. For this reason, Kriptokoin.com and the authors of the articles on the site cannot be held responsible for your investment decisions. Readers should do their own research before taking any action regarding the company, assets or services in this article.
Disclaimer: Advertisements on Kriptokoin.com are carried out through third-party advertising channels. In addition, Kriptokoin.com also includes sponsored articles and press releases on its site. For this reason, advertising links directed from Kriptokoin.com are on the site completely independent of Kriptokoin.com’s approval, and visits and pop-ups directed by advertising links are the responsibility of the user. The advertisements on Kriptokoin.com and the pages directed by the links in the sponsored articles do not bind Kriptokoin.com in any way.
Warning: Citing the news content of Kriptokoin.com and quoting by giving a link is subject to the permission of Kriptokoin.com. No content on the site can be copied, reproduced or published on any platform without permission. Legal action will be taken against those who use the code, design, text, graphics and all other content of Kriptokoin.com in violation of intellectual property law and relevant legislation.