
If we leave aside the short-term movements in Bitcoin with the effect of FUDs and look at the big picture, we see that we are not facing a very heartwarming picture.

Although short-term fluctuations bring to mind the questions of whether a new rally is coming, we are going through a period when risk must be brought under control. While this check will deprive you of some gains, it will help you survive a bad scenario.
Low Appetite for Risk
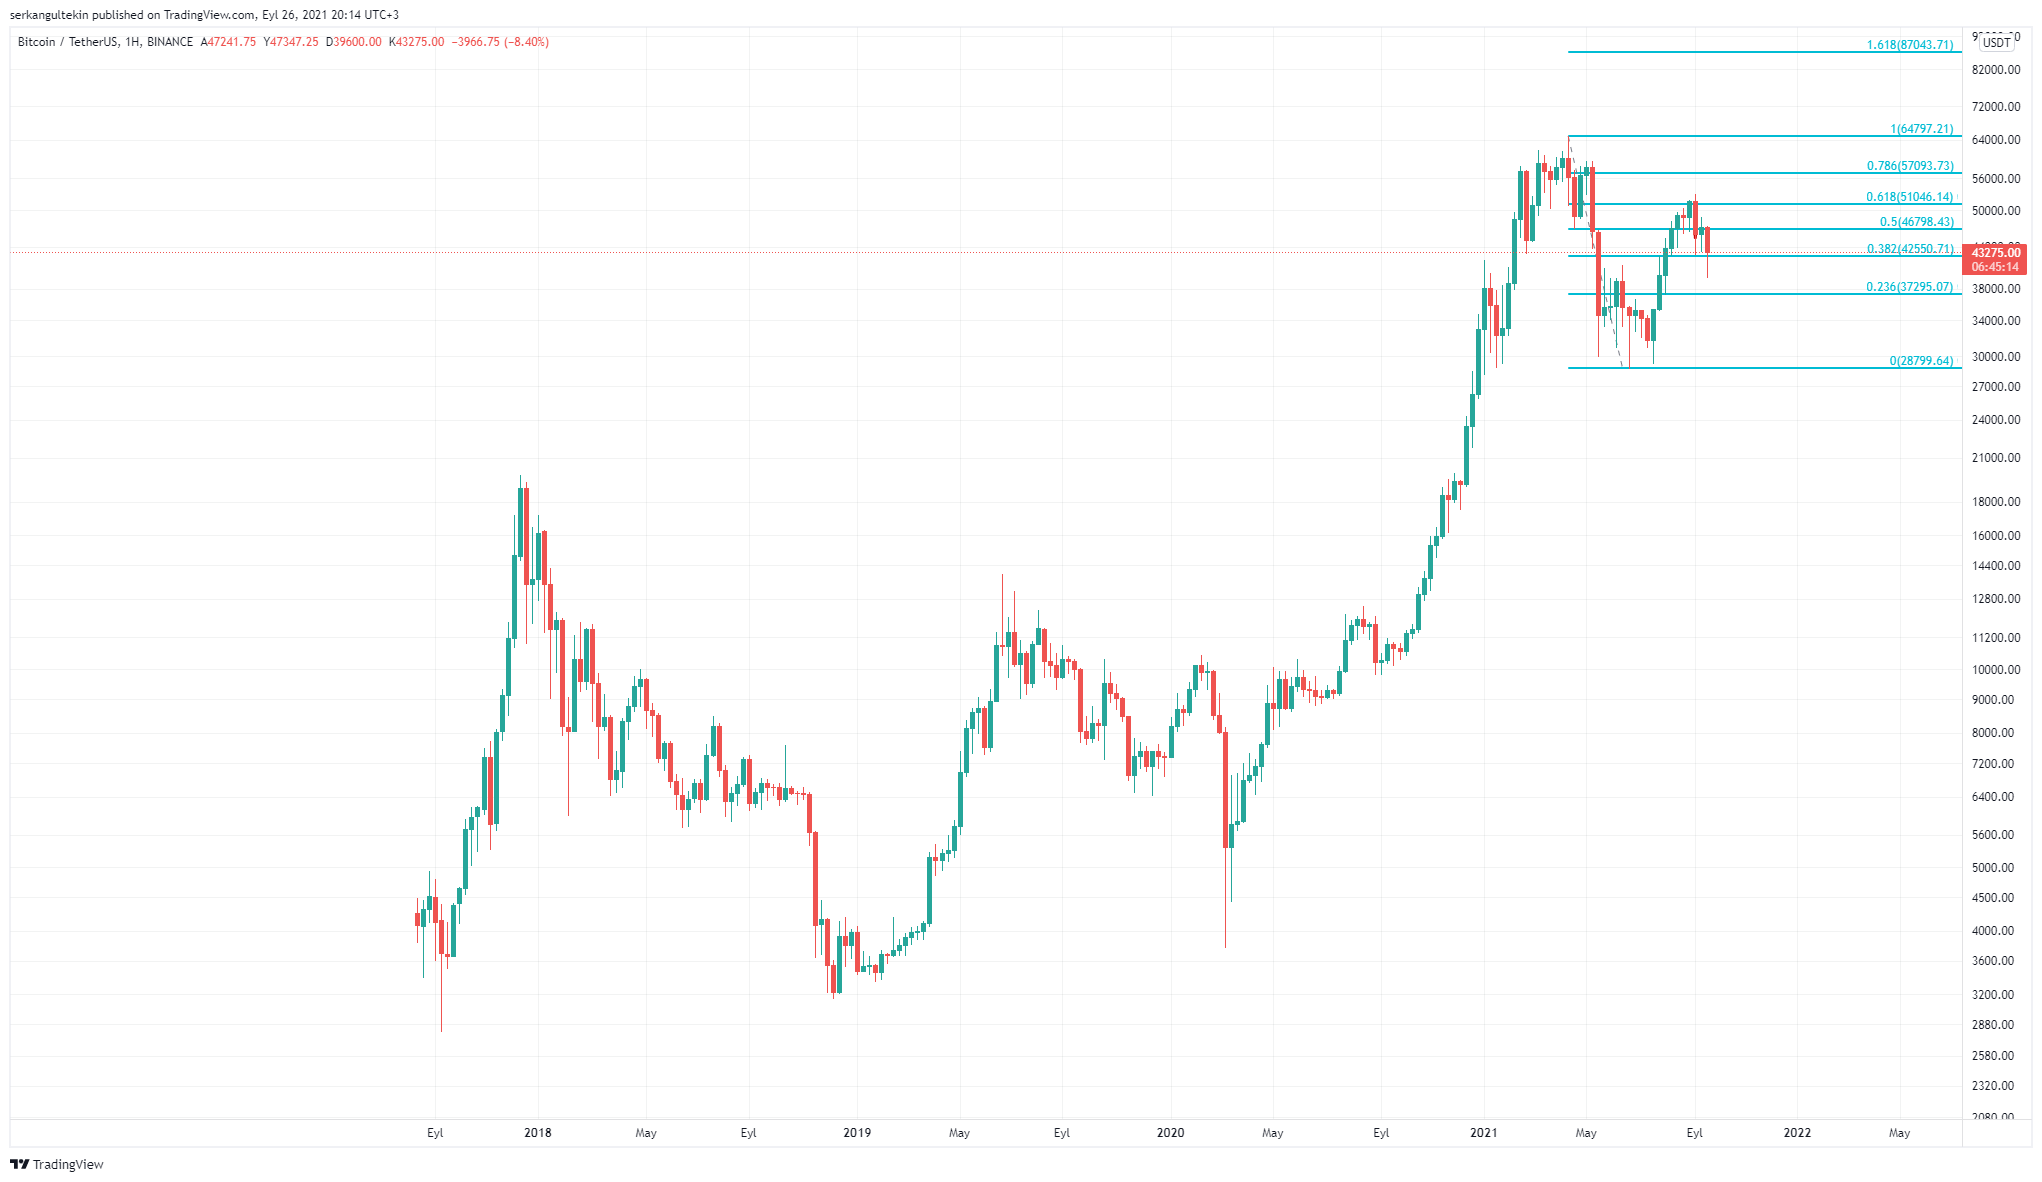
When we look at the Bitcoin chart technically, we see a Bitcoin with a dead cat bounce at $30,000 and a rejection at the fibonacci 0.618 level. The technical picture is not very encouraging. This reduces the risk appetite of new buyers.

At this point, although some on-chain data says we still have a way to go, according to some, the cycle is complete.
Our LTH-NUPL Direction Says Downward
According to the “Net unrealized profit/loss” (LTH-NUPL) chart of wallets with long-term Bitcoin holders published by Glassnode, Bitcoin has peaked and we are on our way to new lows.
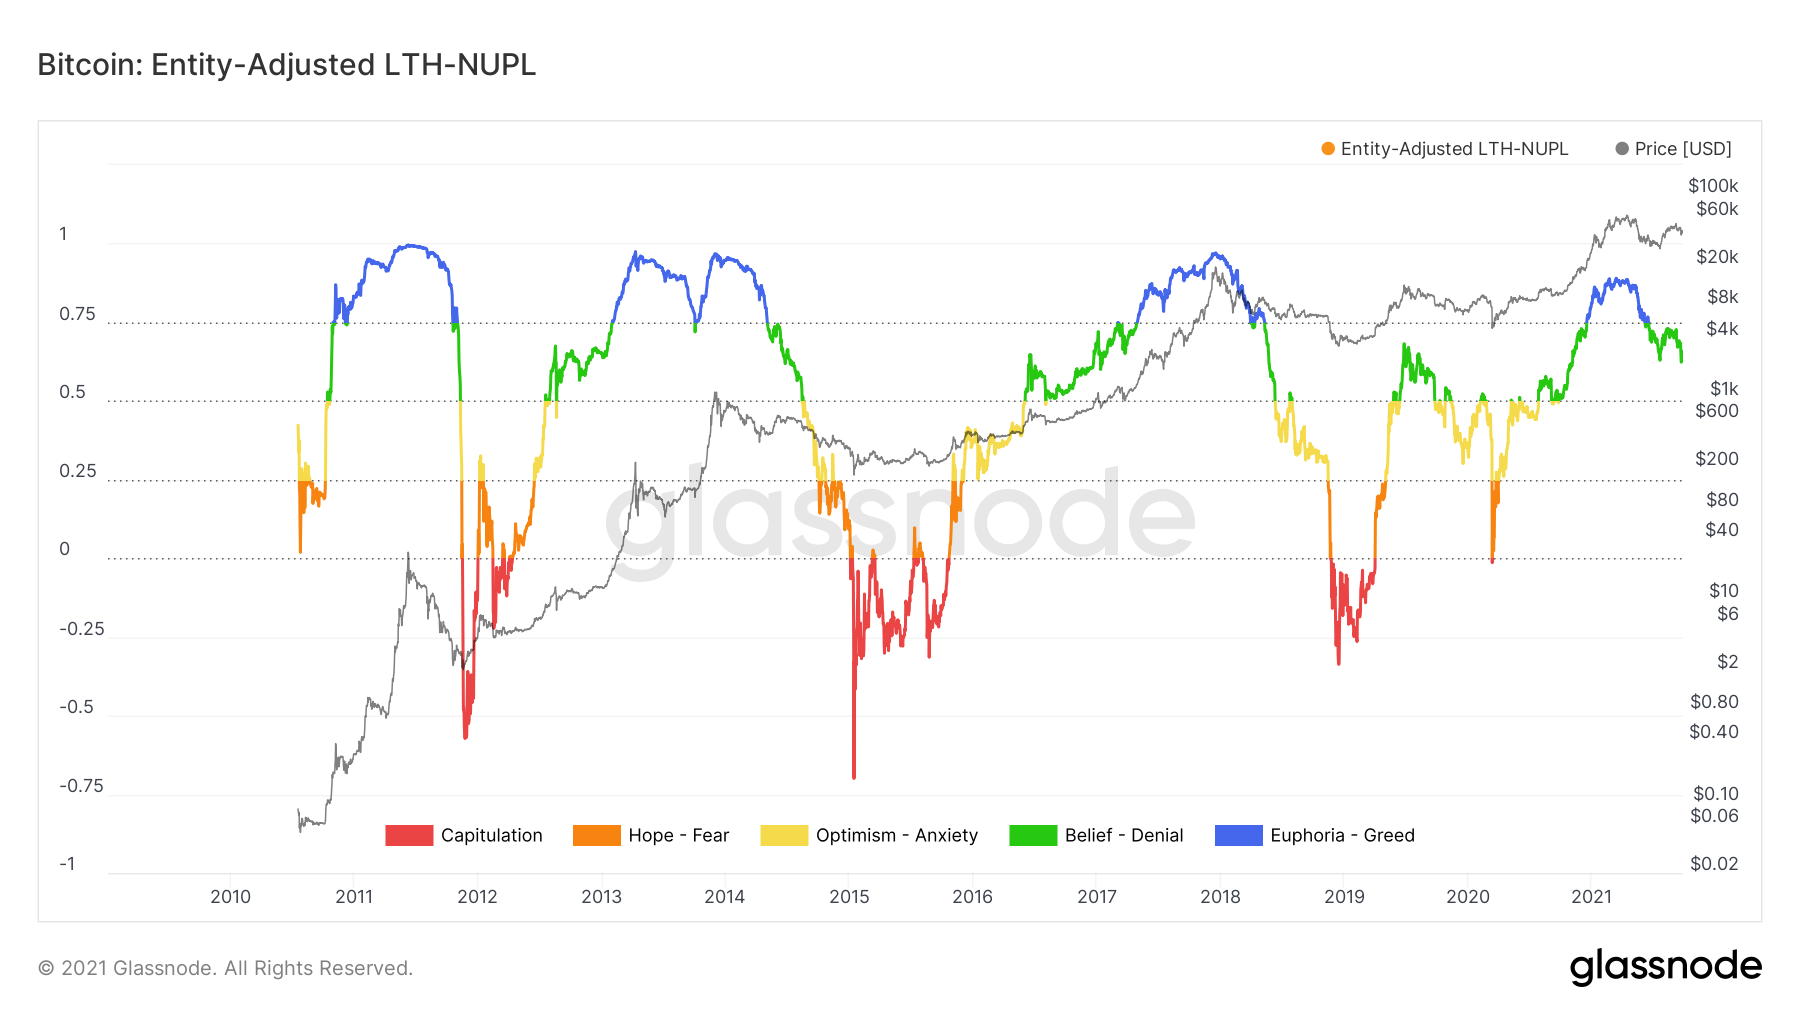
As can be seen in the chart, peaks are seen in Bitcoin when this indicator leaves the blue zone (greed). The real bull market starts at the entrance to the blue zone. The first moment we enter this region can be considered as the beginning of the bull and the end of our exit.
We see that this table works very well in 2012, 2013, 2014 and 2017. We see that we descended into the red zone again after every summit, except for 2013. According to this chart, the orange and red zones indicate very good buying opportunities in Bitcoin and altcoins.
When we look at the current situation, we observe that we descended to the green zone after the peak was seen in the blue zone. When we look at this indicator and previous price movements, we see that our general direction is down, although there are short-term increases.
When we put aside the fundamental analysis data such as the discussion of the reduction in asset purchases and the strengthening of the dollar, the thesis that our direction is down becomes stronger.
Do not forget that the analyzes made according to such indicators are made for the determination of the general direction of the market and on a long-term basis. Short-term fluctuations are not the subject of this analysis.
It may take months before we land in the orange and red zone. If there is a change in the indicator, we will share its updated version so that you can catch the buying opportunities.
*Not Investment Advice.