

bitcoin The fact that the price is currently stuck in a very narrow region can be explained by the formation of the descending triangle pattern. A move to the top of the descending triangle pattern means BTC has entered the ‘no-trade’ zone. Therefore, traders looking for a right spot to invest can make a more accurate move by waiting for a breakout that will determine the price direction.
Key Points in Bitcoin Price Analysis:
- The 20- and 50-day EMAs offer dynamic resistance to Bitcoin price.
- A rising RSI divergence supports the possibility of a bullish reversal.
- Intraday trading volume in Bitcoin stands at $15.4 billion, which means a 50% loss.
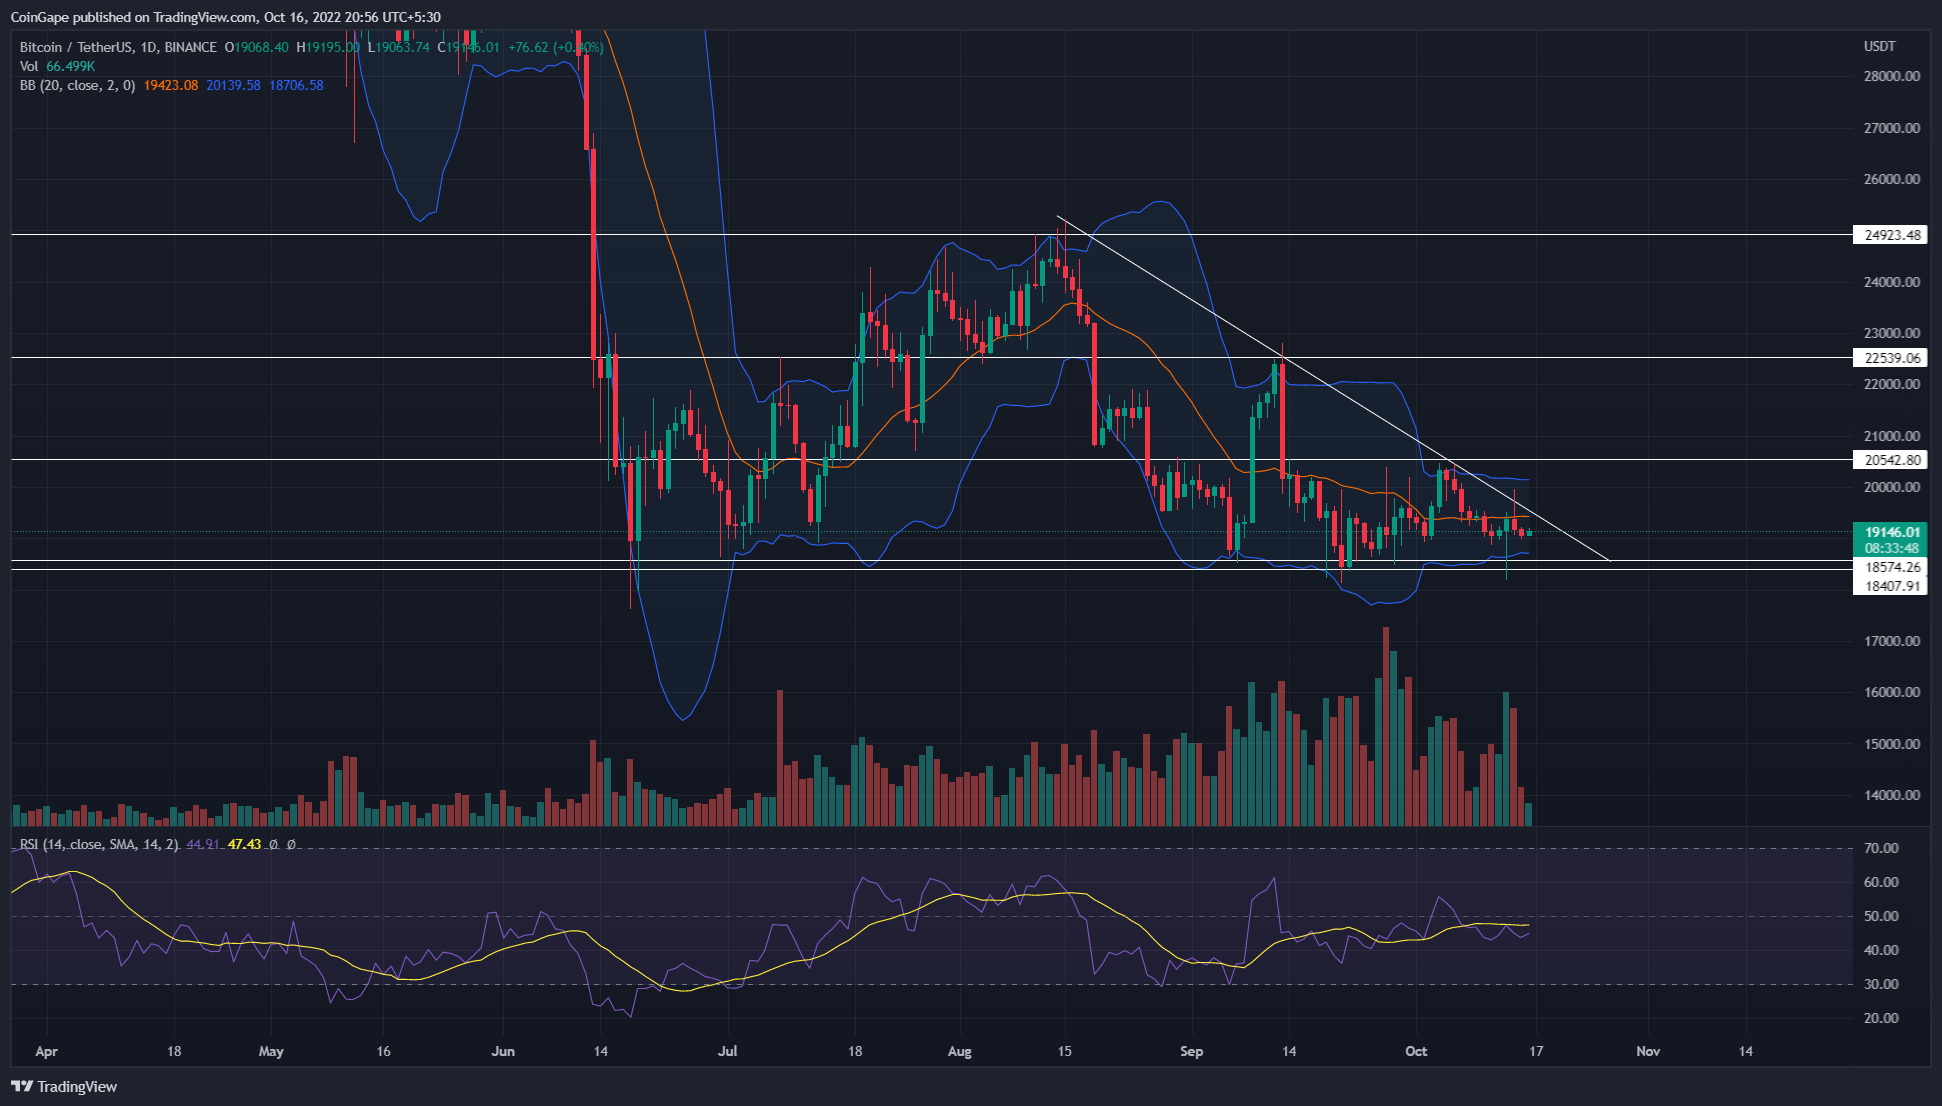

Koinfinans.com As we reported, Bitcoin price has continued to actively respond to a downward trendline and the $18,500 to $18,200 barrier over the past two months. Therefore, the technical chart shows this price action as a descending triangle pattern. Theoretically, this pattern’s series of lower highs indicates a bearish divergence.
Bitcoin price is currently trading at $19,132 with an intraday gain of 0.33%. However, since the CPI data were recently released, cryptocurrency The market has had to deal with high volatility over the past few days.
Also, Bitcoin price is near the top of the triangle pattern, close to the no-trade zone, indicating that a decisive breakout is very strong imminent. Under the influence of this bearish pattern, BTC price must break the $18,500-18,200 support and resume the current downtrend.
On the Bitcoin price chart, a daily candle closing below the $18,200 support will accelerate the selling momentum and drop prices by 13.6% to reveal the $16500 level.
In the opposite scenario, if the market sentiment improves and the buyers manage to make a bullish breakout from the descending trendline, the Bitcoin bearish theory will be invalidated. This development will provide an early entry opportunity to capture potential upside.
- RSI: A bullish divergence on the daily RSI slope supports buyers for a resistance breakout. However, the current market sentiment is still negative as the benchmark value fluctuates below 50%.
- Bollinger band indicator: It shows that the sellers are in control of the ongoing price behavior.
- Resistance level: $19,600 and $20,600
Support level: $18,000 and $16,500
You can follow the current price action here.
Disclaimer: What is written here is not investment advice. Cryptocurrency investments are high-risk investments. Every investment decision is under the individual’s own responsibility. Finally, Koinfinans and the author of this content cannot be held responsible for personal investment decisions.