
While the broader crypto market struggles with volatility, SUI has recorded a strong rally, with significant trading volume and a significant increase in the network’s Total Value Locked (TVL). This positive trend, which turns into a rolling bottom formation, indicates the possibility of a long-term and sustainable rally. Is this rebound the key to hitting an all-time high in February?
Will SUI Price Exceed the $2 Limit?
- A rolling bottom formation is leading to the current recovery trend in SUI price.
- The rising price may face significant supply pressure at $1.68 and $1.875.
- Intraday trading volume on SUI is $513 million, indicating a loss of 7.5%.
Amid the broader market recovery, SUI coin entered a new recovery in late October 2023, when its price recovered from $0.364. This positive reversal turned into a sustained rally, sending the altcoin up 341% to $1.6.
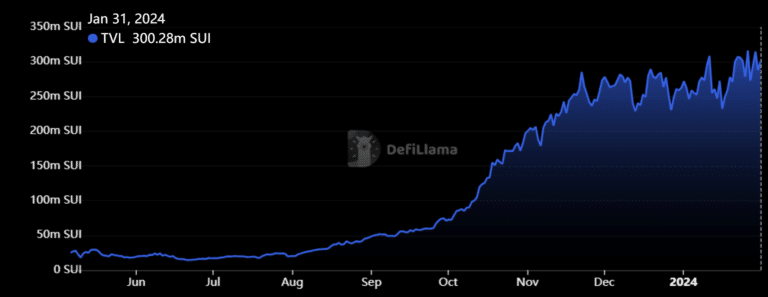
This momentum has also been reflected in the DeFi sector, where the Total Value Locked (TVL) of the SUI network has increased by an impressive 1000% in the last four months, reaching $455 million, as reported by DefiLlama. This increase puts Sui among the top 10 global blockchains according to TVL, surpassing Base, Cardano and Bitcoin.
Considering the daily charts, altcoinThe price action of is seen to form what looks like a rolling bottom formation. This formation, which typically appears at the end of major bear cycles, often heralds a new recovery phase.
Koinfinans.com As we reported, applying the Fibonacci retracement tool shows that the recent correction has revived buyer interest and extended the current uptrend. If this positive momentum continues, it is possible for SUI price to target $1.677 in the near term and reach a new all-time high of $2.77.
However, this trajectory is not expected to be linear, as SUI’s price history shows a tendency towards periodic pullbacks that contribute to the overall growth pattern.
- Exponential Moving Average (EMA): The 20 and 50-day EMA provide strong dynamic support to SUI during market corrections.
- Average Directional Index: At a high of 32%, the ADX indicator highlights that buyers may soon run out of steam and will require some pullback to sustain long-term growth.