
Gold exceeded $ 2,000 due to safe haven demand as we entered the weekend. Bitcoin, on the other hand, maintained a horizontal course over the weekend and maintained its level of 34 thousand dollars. There is a critical data and event agenda next week. Markets will first follow the Federal Reserve’s monetary policy meeting. In addition, he will look at the October employment data from the USA. More importantly, it will carefully monitor geopolitical developments. Market analyst Eren Şengezer evaluates the impact of the agenda on the markets. Additionally, he looks at the technical picture of gold and BTC.
The event of the week will be the Fed interest rate decision
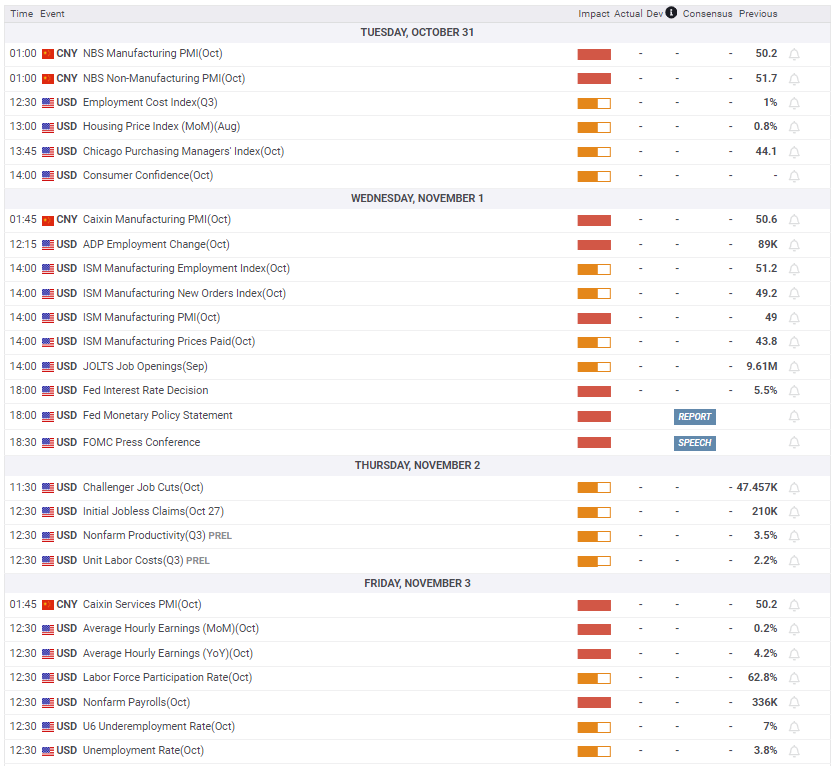
NBS Manufacturing PMI and Non-Manufacturing PMI data from China will be evaluated for a new momentum in the Asian session on Tuesday. At the beginning of the month, optimistic growth and Retail Sales data from China provided support for gold. Moreover, a similar reaction is possible if PMI surveys show that the expansion of private sector economic activities is accelerating. However, the impact of PMI data on gold will probably be short-lived. Because the Fed will announce its monetary policy decisions on Wednesday.
Estimates are that the Fed will leave the policy rate unchanged in the range of 5.25%-5.5%. Despite impressive Q3 GDP data, CME Group FedWatch Tool shows markets are pricing in a roughly 80% chance that the Fed will keep interest rates unchanged in December. If the Fed confirms that additional tightening is not needed this year, it is possible that the dollar will come under downward pressure again. Also in this case, US yields will turn south. In this scenario, gold and BTC are likely to gain upward momentum. On the other hand, the Fed may leave the door open for another interest rate increase in December, citing the strong economy. This will likely put downward pressure on gold and BTC.
Gold investors will also monitor non-agricultural employment data
On Friday, the U.S. Bureau of Labor Statistics will release its October employment report. There could be a stronger-than-usual reaction to the employment data if the Fed adopts a neutral tone and says it will evaluate the data before deciding whether policy is currently restrictive enough. Nonfarm Payrolls (TDI) coming in at or above 250,000 could cause investors to re-evaluate the interest rate outlook and trigger a new USD rally, drawing hawkish Fed bets. A disappointing figure below 150,000 would highlight easing conditions in the labor market. It is possible that this will help the gold price maintain its ground.
Geopolitical developments will remain on the agenda of market players
Meanwhile, market participants will continue to pay close attention to headlines surrounding the Israel-Hamas conflict next week. An easing of the crisis could open the door to a deep downward correction for the gold price, which has gained more than 8% since Israel declared war on Hamas following the October 7 attack.
Gold price technical view
The gold price started to decline after initially rising towards $2,000. This confirmed the importance of resilience. Meanwhile, the Relative Strength Index (RSI) indicator on the daily chart rose to 70. It also shows that buyers are waiting for gold to make a technical correction before adding to long positions. On the downside, $1,960 stands as an initial support. A daily close below this level is possible to attract technical sellers. This could open the door for another decline towards $1,935, where the 200-day Simple Moving Average (SMA) is located, and $1,925 (100-day SMA).
$2,000 (psychological level, static level) is the first significant resistance for the gold price. Once this level is confirmed as support, $2,020 (static level) and $2,040 (static level) stand as the next upside targets.

Bitcoin price technical outlook: The rally may continue but…
Bitcoin’s rally remains intact thanks to the persistent production of higher highs and higher lows. BTC bulls failed in September and formed a lower top on the weekly chart. However, this was followed by a major increase in bullish momentum that formed a higher high this week. Technical data points to the rise. However, investors need to be careful as the rally was driven by BlackRock’s spot ETF ticker listing on the DTCC website. Other reports showed that this has been available on the website since August. This undermines the meaning behind the recent rally. It can also cause weak hands to book profits.
Beyond market movements, the Relative Strength Index (RSI) is hovering around the overbought level of 70. The last time this happened was at the beginning of April. At that time, Bitcoin price formed a higher high, followed immediately by a pullback that formed a higher low, continuing the 2023 bull rally. Therefore, if a similar situation occurs, BTC is in the right spot for a correction. The incoming pullback is likely to send BTC back to $30,000. But under no circumstances should it breach the last significant low of $25,836. As long as the Bitcoin price remains above this level, the bull rally will continue intact.

On the contrary, if the Bitcoin price does not pull back but strengthens, it is possible that BTC will continue to rise, either due to improving technical data or ETF approval news. In such a case, BTC will first retest the $36,294 barrier. If it breaks this barrier, it is possible for BTC to reach the psychological level of $40,000. cryptokoin.comAs you follow from , the general outlook for Bitcoin price has been on the rise since the beginning of 2023. The current scenario is nothing but bullish. However, on-chain metrics suggest investors should be cautious.
To be informed about the latest developments, follow us twitter‘in, Facebookin and InstagramFollow on and Telegram And YouTube Join our channel!