
Just Bitcoin or diversifying the portfolio? Crypto analyst Rakesh Upadhya describes 4 altcoin projects to watch over the next few days. According to the analyst, these altcoins are well positioned for their rally if Bitcoin price rises above $30,000.
Solana (SOL): Low demand for altcoin
The bulls did not allow the SOL to sink below the downtrend line during the latest leg of the correction. This indicated lower levels of demand.
Buyers will then try to push the price higher to the overhead resistance of $27.12. This remains the key resistance to watch for in the near term. Because if the bulls push the price above this, it is possible for the SOL to rise towards $39. This bullish view is invalidated in the near term if the price drops below the moving averages. In this case, SOL is likely to drop to the key $18.70 support. If the price rebounds from this level, it will indicate that the SOL could oscillate in the wide range between $18.70 and $27.12 for a while.

The moving averages on the four-hour chart have started to rise. Also, the RSI is in the positive territory. This shows that buyers are in control. The bears are trying to stop the recovery at $24. However, if the bulls break this barrier, it is possible for the SOL to gain momentum and rally towards $25.50. If the bears want to prevent the rally, they will need to quickly push the price below the 20-EMA. If the price starts to drop, the 50-SMA will be the support level to watch here.
Cosmos (ATOM): Bulls vigorously defend support
The long tail on the ATOM April 26 candlestick shows that the bulls are fiercely defending the $10.20 support.
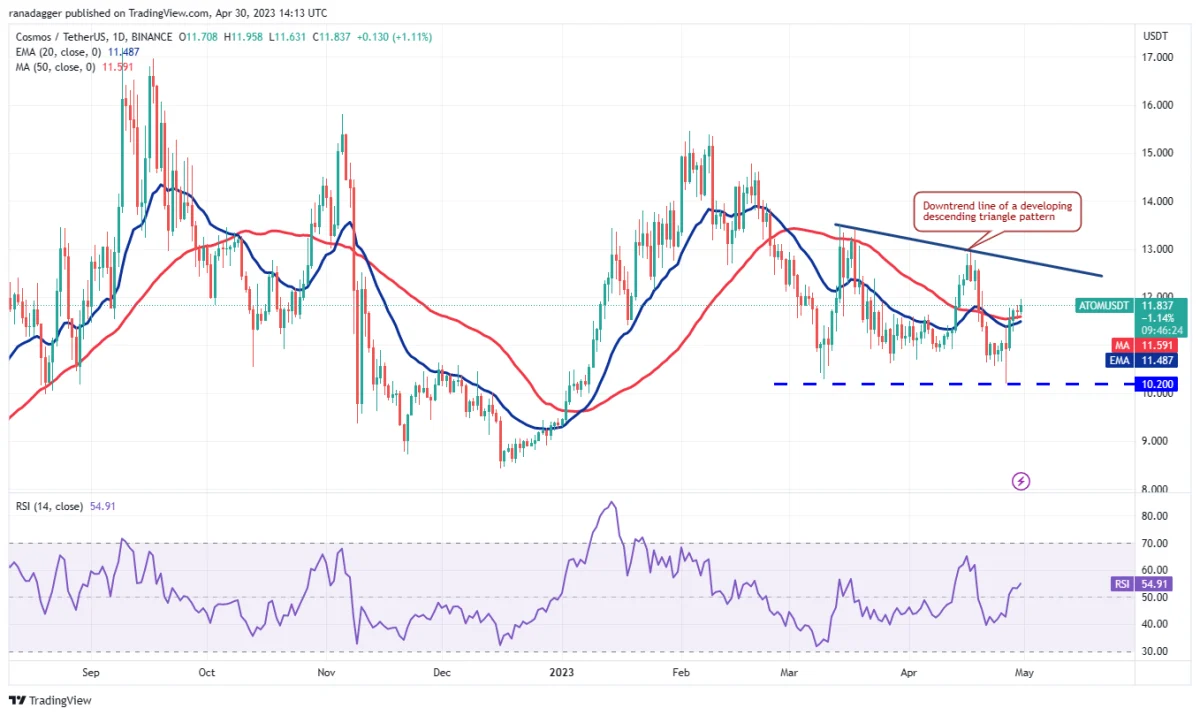
Buyers have pushed the price above the moving averages and will try to reach the bearish trend line. This is an important level to consider. Because a break and close above it would open the doors for a potential rally to $13.50 and then $15.50. On the other hand, if ATOM changes direction from the downtrend line, it will show that the bears are trying to form a descending triangle pattern. A drop below the moving averages would open the doors for a possible retest of $10.20.

The 20-EMA on the 4-hour chart has turned up. Also, the RSI is close to the overbought zone. This shows that the bulls are in control. There is a small hurdle at $12.13. However, this is likely to be exceeded. It is possible for the altcoin price to rise later to test the bearish trend line. Instead, if the price turns down $12.13, the bears will again try to push the ATOM below the 20-EMA. If they manage to do this, it will likely show that buyers will be losing control. In this case ATOM risks shifting to the 50-SMA later on.
Internet Computer (ICP): Altcoin launches strong recovery
ICP broke below the 50-day SMA ($5.38) on April 26. However, we witnessed that this is a bear trap. The price rallied on April 27 and started a strong recovery.

The 20-day EMA ($5.74) has started to rise. Also, the RSI has jumped into the positive territory. This shows that the bulls have a slight advantage. If the price does not drop much from the current level or recovers from the 20-day EMA, this will indicate that the bulls are buying the lows. This will increase the probability of a rally to the downtrend line, where the bears will again be on a strong defense. On the downside, breaking below the 50-day SMA will turn the advantage in favor of the bears.

The 4-hour chart shows the ICP is in a corrective phase. An initial support is at the 20-EMA, near the 38.2% Fibonacci retracement level of $6.14. If the price bounces off this support, the altcoin is likely to rally to $7.23 and eventually to $7.70. Contrary to this assumption, if the price continues to decline and dips below the 20-EMA, it will indicate that short-term bulls have booked profits. This could also push the price towards the 50-SMA, which is near the 61.8% retracement level of $5.72.
Hedera (HBAR): Bulls hold their ground
cryptocoin.comAs you can see from , the bears tried to sink Hedera many times. The price declined below $0.06 but the bulls held their ground. Failure to break the support has attracted buyers who will try to push the price above the downtrend line.

The 20-day EMA ($0.06) is flattening and the RSI has climbed above the midpoint. This shows that the selling pressure is decreasing. If buyers push the price above the resistance line, further bullish momentum is possible. Thus, HBAR is likely to rise to the overhead resistance of $0.08. Conversely, if the price turns down from the current level or resistance line, it will indicate that the bears remain active at higher levels. This increases the probability of a drop below $0.06.

The 4-hour chart shows that the bulls have turned the moving averages to support, starting a bullish move that is likely to reach the resistance line. It is possible for this level to act as a strong resistance. But on the way down, if the altcoin rebounds from the 20-EMA, it will indicate a change in sentiment, from selling on rallies to buying on dips. HBAR is likely to rise above the resistance line later. It is then possible to start its journey towards $0.07 and then towards $0.08. If the bears want to seize the edge, they will need to quickly pull the HBAR below the moving averages.
Contact us to be instantly informed about the last minute developments. twitter‘in, Facebookin and InstagramFollow and Telegram And YouTube join our channel!
Risk Disclosure: The articles and articles on Kriptokoin.com do not constitute investment advice. Bitcoin and cryptocurrencies are high-risk assets, and you should do your own research and due diligence before investing in these currencies. You can lose some or all of your money by investing in Bitcoin and cryptocurrencies. Remember that your transfers and transactions are at your own risk and any losses that may occur are your responsibility. Cryptokoin.com does not recommend buying or selling any cryptocurrencies or digital assets, nor is Kriptokoin.com an investment advisor. Therefore, Kriptokoin.com and the authors of the articles on the site cannot be held responsible for your investment decisions. Readers should do their own research before taking any action regarding the company, assets or services in this article.
Disclaimer: Advertisements on Kriptokoin.com are carried out through third-party advertising channels. In addition, Kriptokoin.com also includes sponsored articles and press releases on its site. For this reason, advertising links directed from Kriptokoin.com are on the site completely independent of Kriptokoin.com’s approval, and visits and pop-ups directed by advertising links are the responsibility of the user. The advertisements on Kriptokoin.com and the pages directed by the links in the sponsored articles do not bind Kriptokoin.com in any way.
Warning: Citing the news content of Kriptokoin.com and quoting by giving a link is subject to the permission of Kriptokoin.com. No content on the site can be copied, reproduced or published on any platform without permission. Legal action will be taken against those who use the code, design, text, graphics and all other content of Kriptokoin.com in violation of intellectual property law and relevant legislation.