
December was a bullish month for the cryptocurrency market. We witnessed new annual highs for many tokens. According to crypto analyst Valdrin Tahiri, these 3 altcoins have bullish formations. Therefore, it is possible for them to reach their new goals in January.
ARB price prediction: Altcoin may make a parabolic move!
Arbitrum (ARB) price has increased along the parabolic ascending support trend line since October. Finally, on December 18, it confirmed the trend line (green icon). Additionally, it started the current upward move. So far, ARB price has surpassed the $1.30 horizontal resistance area. Thus, only $1.75 resistance remains before the all-time high at $1.82.
Technical analysts use Elliott Wave theory to identify recurring long-term price patterns and investor psychology. This helps them determine the direction of a trend. The most likely wave count shows the price is in the third wave (black) of a five-wave uptrend. The third wave has expanded for ARB. The subwave count was shown in white. If the count is correct, the third wave will be 2.61 times the length of the first wave. Thus, it will lead to a high of $2.25 for the altcoin. This is approximately 50% above the current price.
Despite this bullish ARB price prediction, a close below the parabolic ascending support trend line would invalidate the count. Then, ARB price is likely to decline by 30% to the nearest support at $1.10.
OP price prediction: It is possible to equal the previous ATH level!
Optimism (OP) price reached an all-time high of $4.18 on December 27. Although it subsequently fell, it confirmed the previous all-time high resistance zone at $3.10 as support (green icon). Such retests usually lead to a continuation of the upward move in the original direction. Meanwhile, the RSI for the altcoin is increasing and is above 50. So both are signs of a bullish trend.
If the upward move continues, the altcoin price could reach the top of the long-term ascending parallel channel that has been in place since June 2022. The resistance trend line of the channel stands at $6.20, 70% above the current OP price.
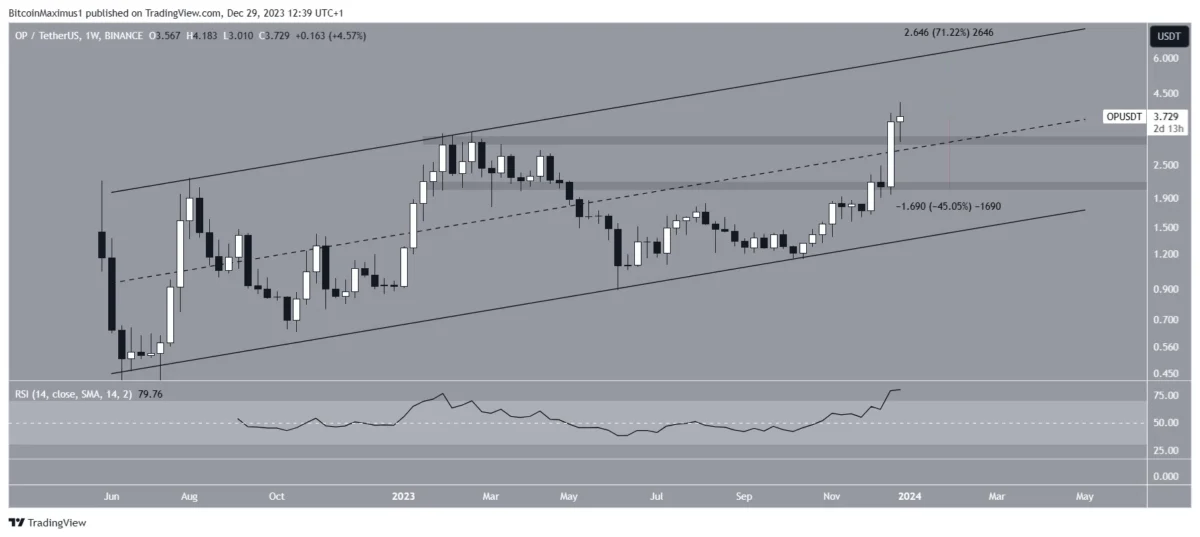
Despite this bullish OP price prediction, a weekly close below the $3.10 support will invalidate this bullish view. Then, it is possible that the OP price will decline by 45% to the nearest support, $2.
GMX price prediction: What’s next for the altcoin?
GMX price broke out of a descending resistance trend line in October. Before the break, the trend line had been in place since the all-time high. The price has increased since it reclaimed and confirmed the $42 level as support (green icon). Additionally, the RSI has moved above 50. That’s why the RSI is supporting this bounce for the altcoin (green icon). GMX faces only resistance at $58 until its all-time high at $92. Therefore, it is possible for GMX to rise 70% to 90 if it reaches a weekly close above the zone.
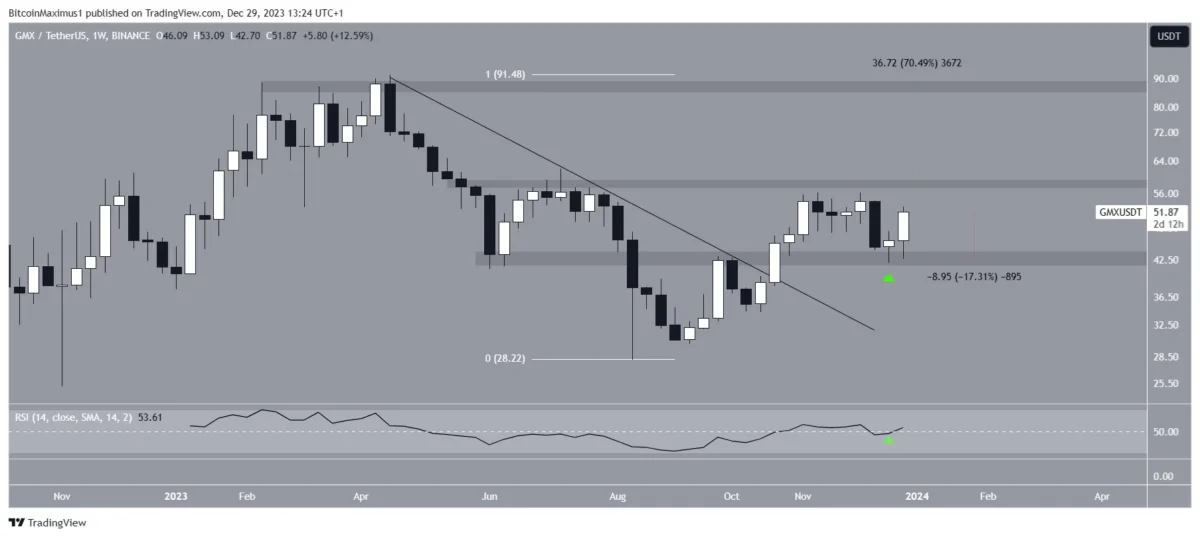
Despite this bullish GMX price prediction, a failure to close above $58 could trigger a retest of the $42 support. This means a 17% decline for GMX.
The opinions and predictions in the article belong to the analyst and are definitely not investment advice. cryptokoin.com We strongly recommend that you do your own research before investing.
To be informed about the latest developments, follow us twitter‘in, Facebookin and InstagramFollow on and Telegram And YouTube Join our channel!