
The leader of the crypto money market, Bitcoin (BTC), started to shake off the market that it had shouldered as of October.

BTC, which entered a beautiful and technical uptrend with October and saw the ATH level of $ 67,000 with an increase of 64%, went down with the incoming profit sales.
BTC, which hit $ 59,562 by pinning under $ 60,000, which is a psychological and technical support, has lost 11% in the last three days. So what awaits BTC next?
Downtrend Broke on RSI!
When the leading cryptocurrency Bitcoin is examined on the 4-hour chart, it is seen that it is subject to a red downtrend.
During this downtrend, BTC, which first broke down the green uptrend and then retested, shows the same movement for the white trend line.
BTC, which broke the white trend line to the downside but found support at $ 60,000, finds buyers at $ 61,000 as of publication time.
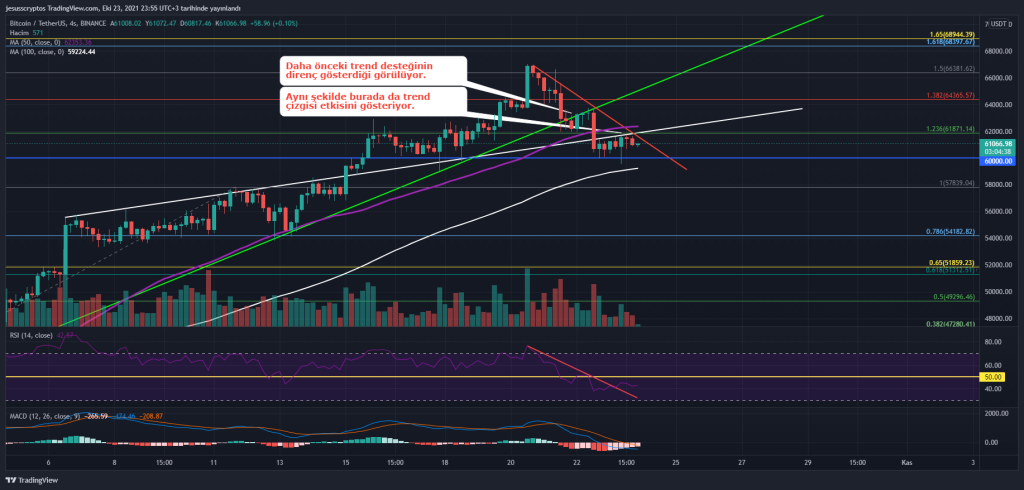
While it is seen that the downtrend in price is also working on the RSI indicator, the RSI has broken this downtrend in today’s 07:00 candle.
The fact that there was no net increase in price after this breakout is thought to be due to the lack of volume over the weekend. And at this point, the price is expected to break the downtrend and try the sideways resistance at $61,871.
However, if this downtrend does not break and a selling wave comes tomorrow, it seems possible to see $60,000 broken.
While it is an inevitable fact that this breakdown will not be good for the market in the short term, the levels of 57,839 – 54,182 and 51,859 dollars await the price as support.
* The above does not constitute investment advice, please take your own investment decisions yourself.