Bitcoin price is still in an upward trend when looking at this year’s price chart. After bottoming around $16,800 in November 2022, BTC price has gained 70%, defying interest rate hike fears while riding on growing ETF approval optimism. Here are the details…
What’s next for Bitcoin price?
However, in recent months Bitcoin bulls have failed to keep the BTC price above $30,000. So, with the “bullish” halving still more than 200 days away, many traders are wondering: Will the Bitcoin price break even again in the coming months? From a technical perspective, Bitcoin price has stabilized around the 0.236 Fib line of the Fibonacci retracement chart from the high of $69,000 (the top of the market) to the low of $15,900 (the bottom of the local market), according to analyst Yashu Gola. This flat BTC price action is very similar to that witnessed during the 2018 BTC price correction.

In 2018, the BTC/USD pair stabilized around the 0.236 Fib line around $6,790 for months before falling to $3,000 in December. The $3,000 level is currently coinciding with multi-year ascending trend line support. Bitcoin is currently repeating 2018 with the price flattening at the 0.236 Fib line. A breakout from this level would mean that BTC price would see $21,500 as the next major support level, down 17.75% from current levels.
Strong dollar increases Bitcoin’s downside risks
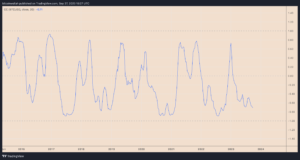
Meanwhile, the US dollar strength index (DXY), which measures the dollar’s strength against a pool of top foreign currencies, reached its highest level since November 2022. The index has been negatively correlated with Bitcoin throughout 2023, as shown below. Following the FED’s interest rate decision last week, the dollar’s rise accelerated and DXY is now painting its 11th consecutive green weekly candle. In other words, Bitcoin’s upside prospects may remain limited if the dollar continues to climb following the DXY gold crossover.

Are “old” Bitcoins sold?
Bitcoin’s on-chain metrics paint a mixed picture. Bitcoin’s Coin Day Destroyed (CDD) metric, which measures the movements of long-term investors, rose on September 19, showing some long-term BTC holders moving their coins, indicating possible profit-taking or repositioning. Investors should be careful about this, as most CDD increases have historically occurred before price decreases. On the other hand, Bitcoin reserves across all crypto exchanges continue to decline, indicating increased hodling behavior among investors.

What do Bitcoin trading analysts say?
Bitcoin analysts are also divided on where the BTC price could go in the coming months. For example, popular trader Skew argues that the BTC price could reach $30,000 by October. He notes that a thin liquidity question around $27,000 will likely lead to a breakout. However, fellow analyst Rekt Capital does not rule out a price correction towards $18,000 based on the pre-halving fractal shown below. “History shows that the next 140 days will be crucial for dollar-cost-averaging in preparation for the post-halving parabolic rally,” Rekt Capital said.

To be informed about the latest developments, follow us Twitter’in, Facebookin and InstagramFollow on . Telegram And YouTube Join our channel.