

Happened last year bitcoin The analyst, who correctly predicted the collapse, explained his current views. The analyst stated that BTC is close to coming to the end of a bear market.
The analyst, known by the pseudonym Dave the wave, commented on Bitcoin’s daily pattern. According to the analyst, it is possible to see a classic reversal pattern on the daily chart.

“Have we reached a bottom for Bitcoin? The analyst used the Adam and Eve model. This pattern occurs when a sharp V-shaped first dip is made at high volume. This is the first ‘Adam’ low Then the price rises again but then falls to form a second ‘cup pattern’ as a second low. As a matter of fact, this is a harbinger of decreasing volatility and a tighter price range.”
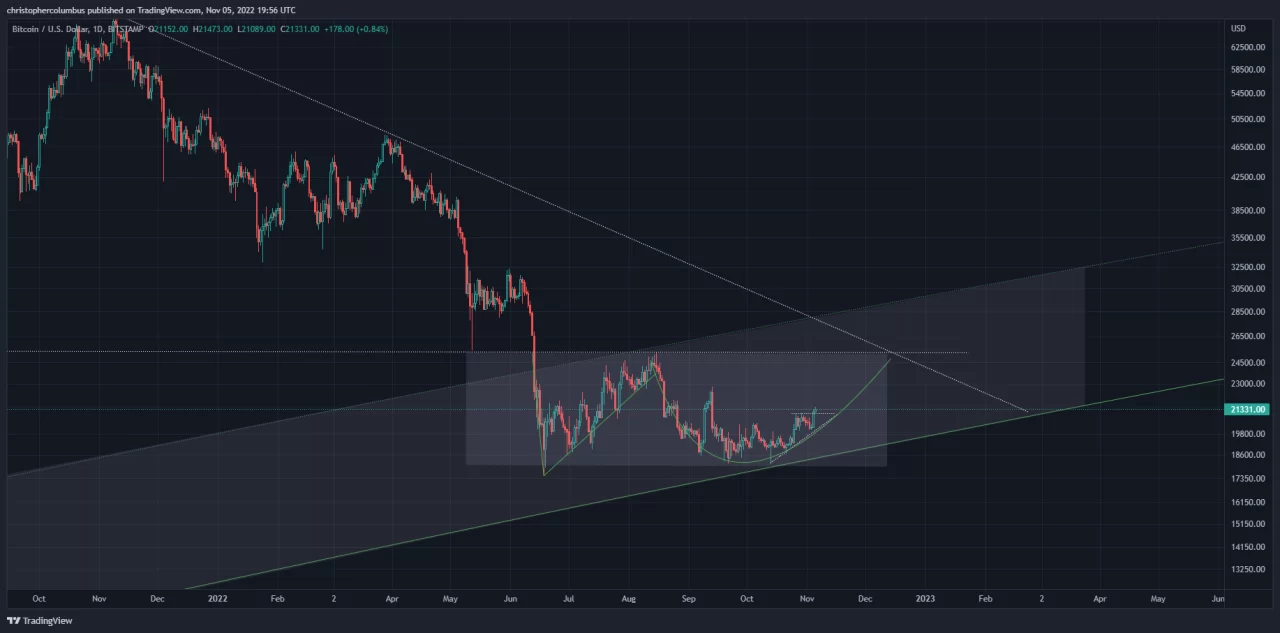
Koinfinans.com As we reported, the pattern is traditionally a bullish formation as it suggests that market participants are in the process of accumulating the asset while forming and defending a price bottom. Based on Dave the Wave’s chart, it seems that the bottom of BTC is around $18,000 and the pattern is confirmed around $25,000.
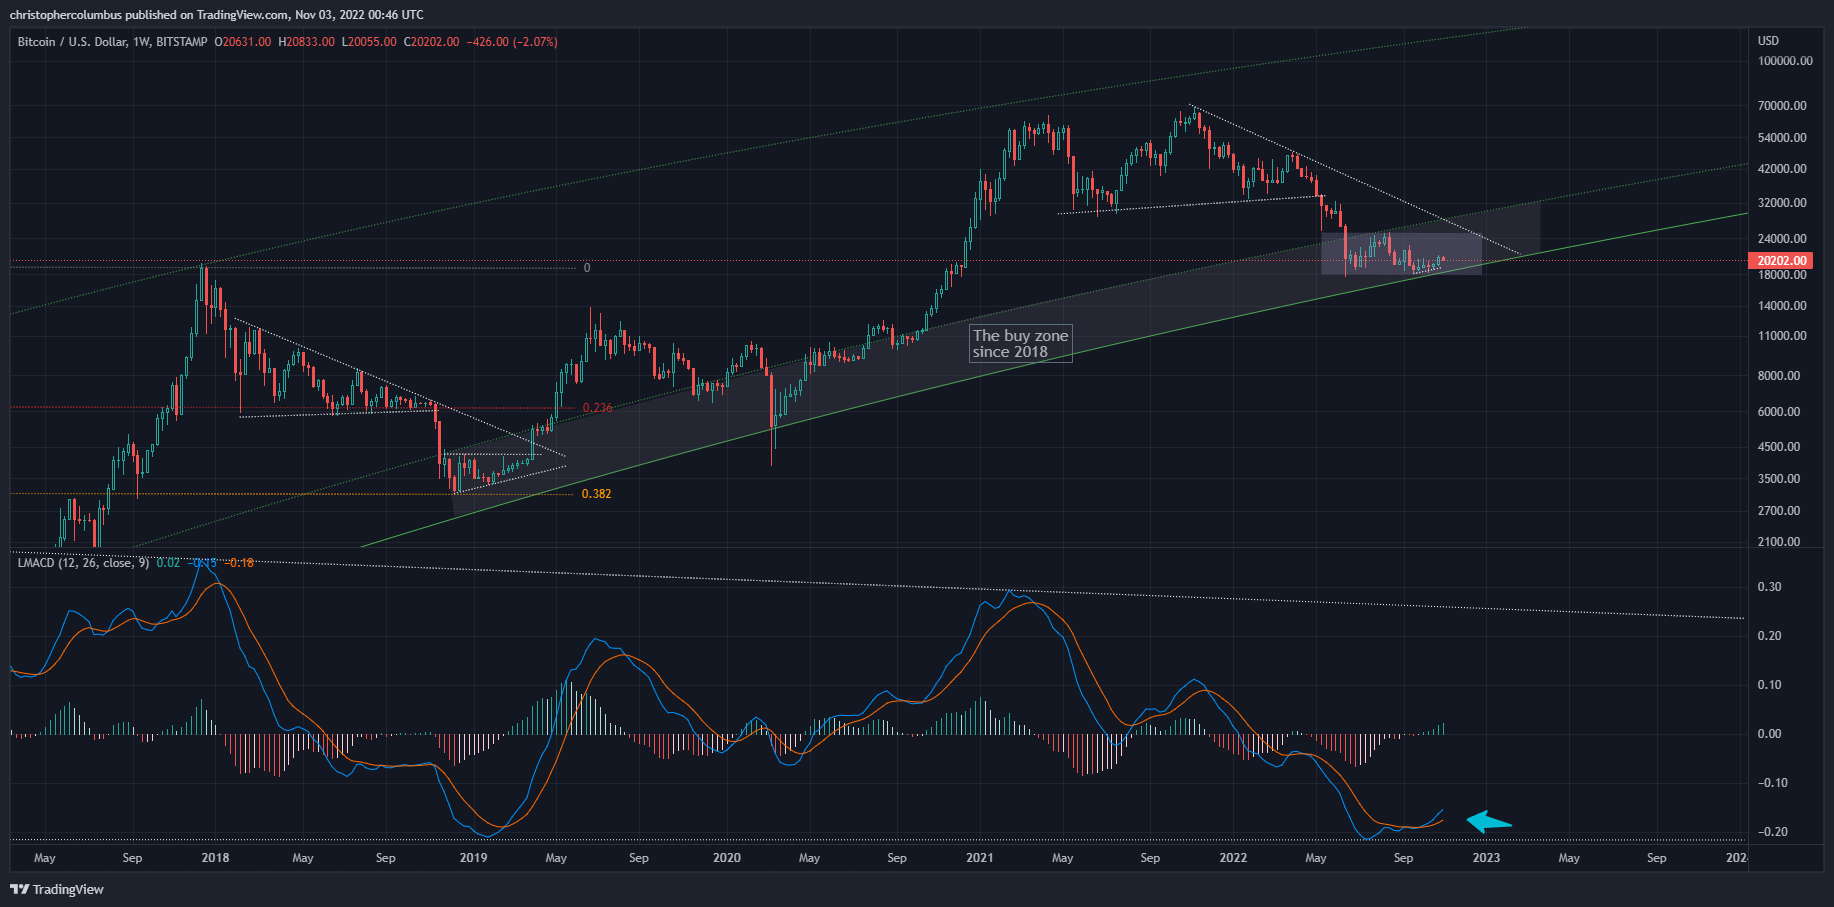
On the weekly chart, he underlined that the LMACD indicator gives a bullish signal. The analyst recalled a level of the weekly LMACD that marked the end of the 2018/2019 Bitcoin bear market. According to the analyst, it is possible to see a similar formation at the moment.
As a result, the indicator is designed to reveal changes in an asset’s trend, strength and momentum.
“The long-term momentum indicator serves to smooth out the reactive sentiment regarding the volatility of the day and even weekly non-close candles.”
You can follow the current price action here.
Disclaimer: What is written here is not investment advice. Cryptocurrency investments are high-risk investments. Every investment decision is under the individual’s own responsibility. Finally, Koinfinans and the author of this content cannot be held responsible for personal investment decisions.