
Technical analysis in the weekly time frame, dogecoin It shows that the price has fallen below a descending resistance trend line since October 2022. The decline led to a low in June 2023. Dogecoin has increased since then.
After forming a higher low in October, meme coin The price accelerated its rate of increase and broke out of the resistance trend line the next month. The trend line had stood for 400 days before it was broken.
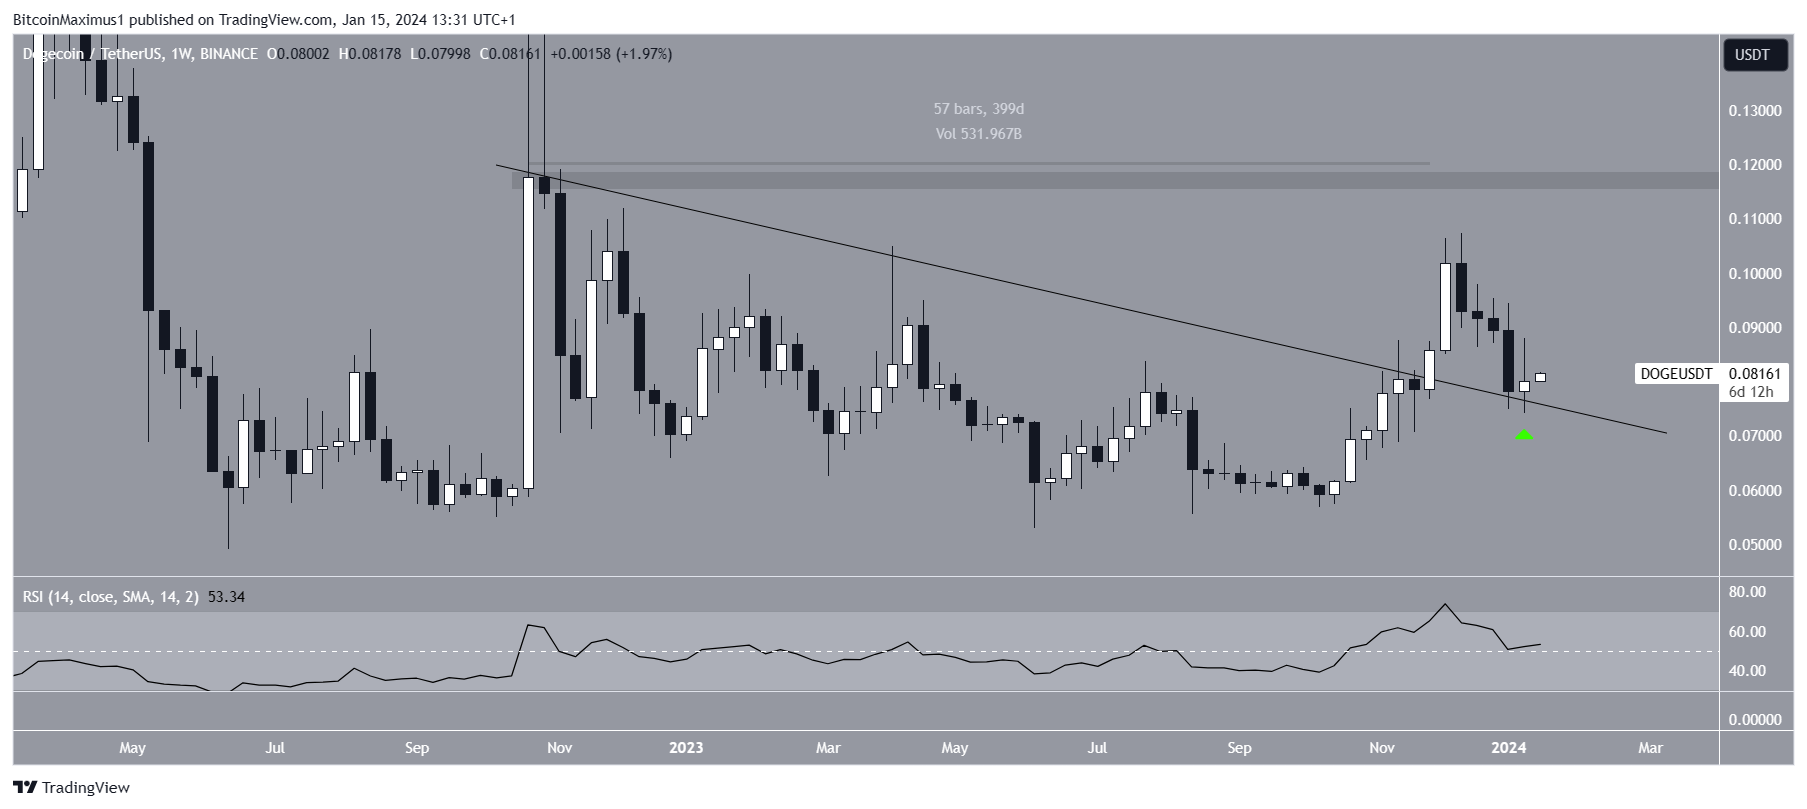
When evaluating market conditions, investors use the RSI as a momentum indicator to determine whether a market is overbought or oversold and whether an asset should be accumulated or sold.
If the RSI reading is above 50 and the trend is upward, the bulls still have an advantage. But if the reading is below 50, the opposite is true. The weekly RSI is supporting a bounce as the price bounces at 50 as it tests the resistance trend line.
Dogecoin Price Prediction: Could the Price Reverse the Trend?
While the weekly time frame technical analysis shows a bullish retest, the daily chart is in a downtrend.
The daily time frame shows that the DOGE price has been trading within an ascending parallel channel since June 2023. After breaking out in December, the price retested the resistance trend line twice (green icons).
However, it did not show sufficient flexibility as it fell back within the channel at the beginning of 2024. On January 11, DOGE confirmed the resistance trend line of the channel (red icon) and fell.
Despite this bearish price action, cryptocurrency trader WorldOfCharts suggested that DOGE price will increase significantly soon. In the tweet he shared
Consolidation in the bull pennant and a breakout is expected soon. A successful breakout could lead to a 45-50% bull rally.
he stated.
Moreover, Elon Musk He confirmed that he still has Dogecoin. However, the daily RSI is also giving a mixed reading. While the indicator is increasing, it is still below 50.
Ultimately, whether the DOGE price breaks out of the channel or below its midline will determine the future trend.
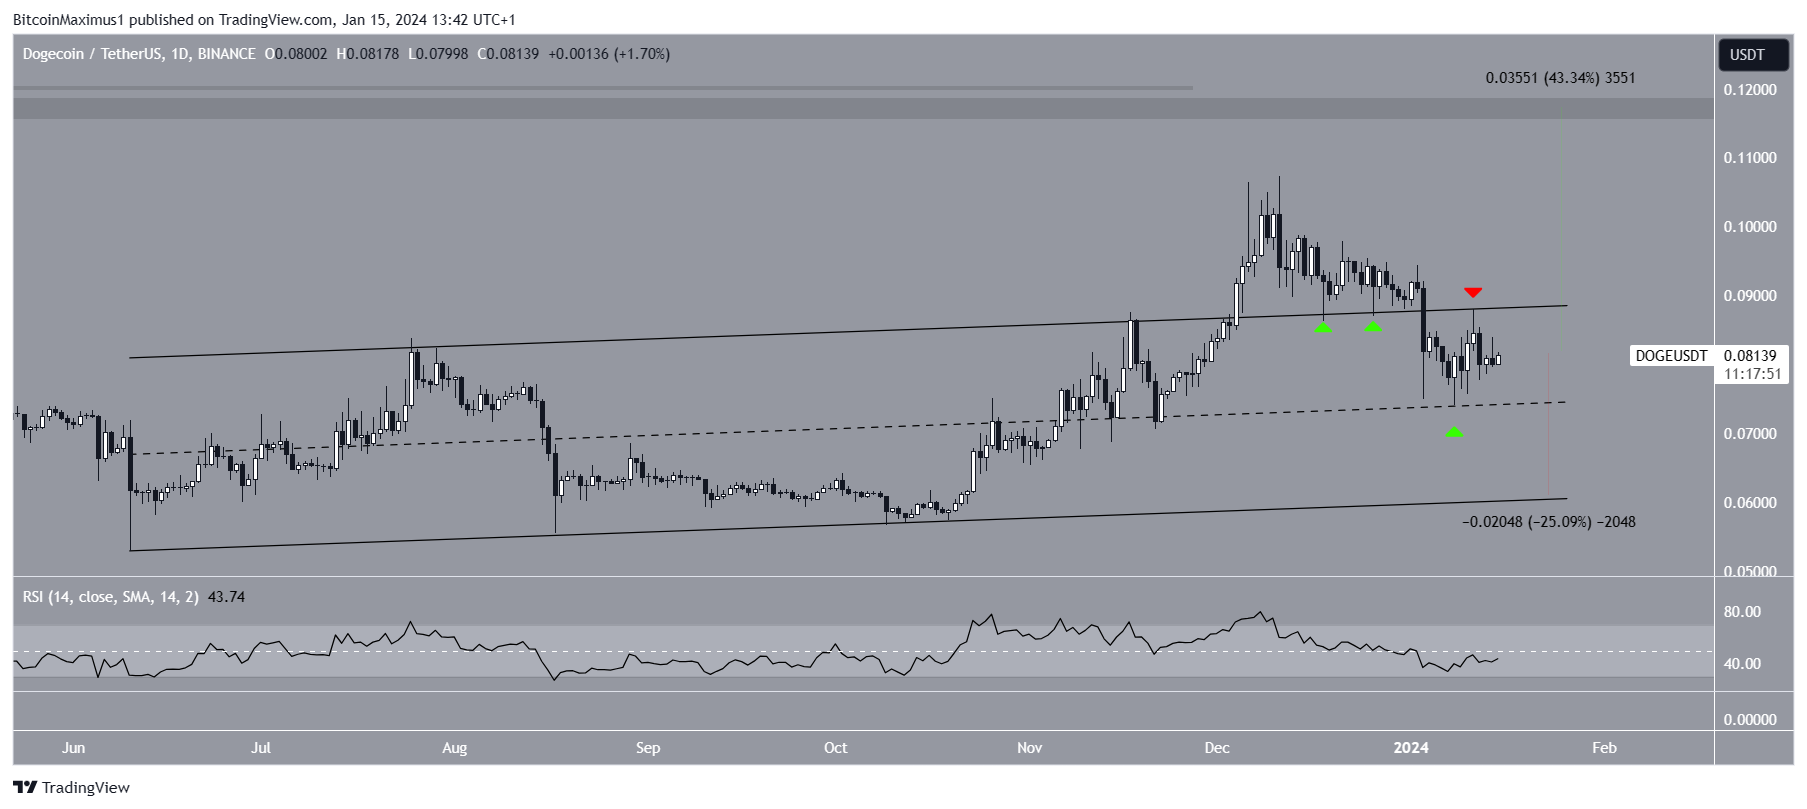
A breakout from the channel could initiate a 45% rally to the next resistance at $0.115. Conversely, a break below its midline could lead to a 25% decline at the support trend line at $0.062.