
Cardano (ADA) showed a false break above a key resistance level. This risks triggering a drop to the critical support level of $0.3.
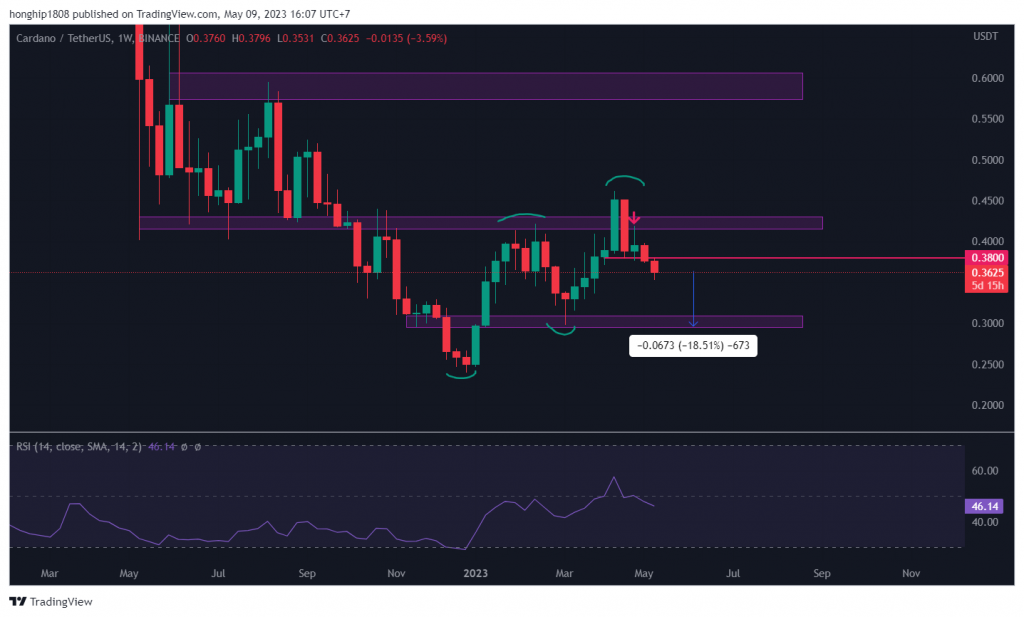
Cardano priceIt has been trying to form a bullish structure since hitting the low of $0.24 at the end of December 2022. This rise helped the price rise above the horizontal resistance level of $0.42 during the week of April 10-17. As a result, the price reached a high of $0.46. However, the following week, a bearish chart would emerge and the price would drop below $0.42. While the wick seen on the chart is interpreted as a bearish signal, the bearish risk continues.
Indeed, after confirming the $0.42 level as resistance during the week of April 24 – May 1, ADA price It broke below the low of the engulfing bearish pattern ($0.38), marking the continuation of the previous decline. Therefore, Cardano price could test the important support level of the uptrend structure at $0.3, which is about 20% lower from the current level.
The weekly RSI indicator supports this possibility as it dips below 50 and is trending downwards.
Cardano Is In An Emerging Parallel Channel
The daily chart shows that Cardano price is trading inside an ascending parallel channel since the year low of $0.24. This is interpreted as a bearish pattern leading to a collapse in most cases. These predictions have even stronger arguments as the price is currently trading at the bottom of the channel and the RSI is approaching the oversold region.
As a result, the price is likely to drop below the support line of the channel at $0.34 and a drop to the long-term support level at $0.3 as mentioned above. However, the price might bounce back from the 0.34 support level and retest $0.38.
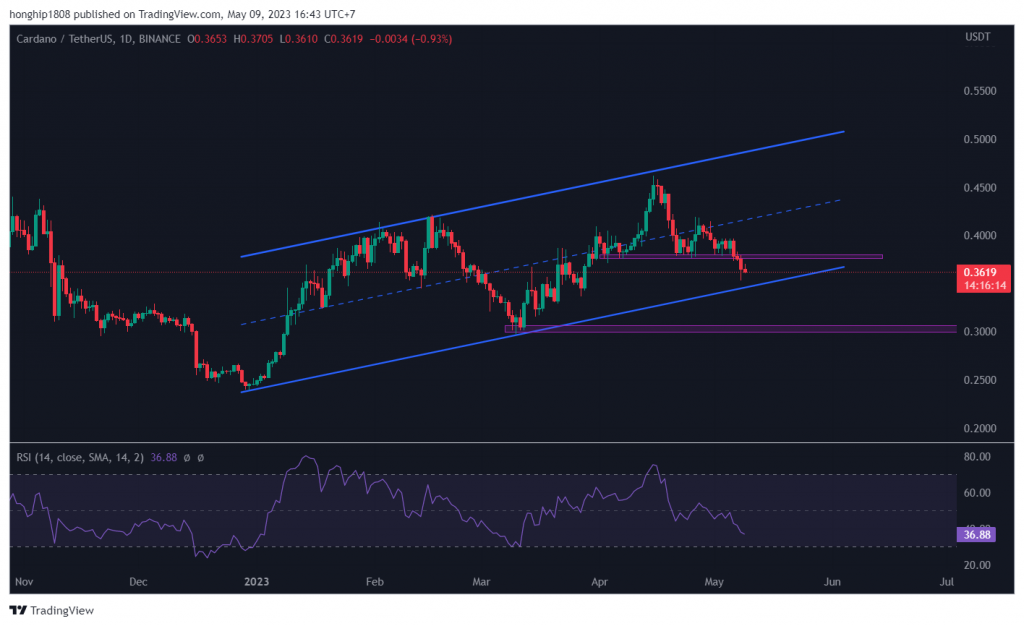
The most likely view is that ADA price will continue to drop to $0.3. A break below the support level below $0.34 will confirm this possibility.
You can follow the current price action here.