
cryptocoin.com As a result, we will touch on the bullish pattern situation that appears on the charts for 5 altcoins. Let’s see what moves these altcoins will make in the coming days.
Altcoin NEAR Protocol
NEAR Protocol (NEAR) price retraces support from yearly low. It broke above the short-term downtrend pattern. The recovery momentum is likely to continue in the coming days. The altcoin NEAR Protocol (NEAR) price has been on the decline since hitting a yearly high of $2.84 on February 6. This move pushed the price below the key $1.25 support level. After that, it fell below $1.15. However, NEAR’s price quickly landed in the area where it was declining. It reclaimed the $1.25 level.
This move is causing the previous breakout to be a divergence (blue circle). Afterwards, it usually leads to a strong rally. Therefore, there are chances of it hitting the previous support level of $1.7, which corresponds to a 25% increase from the current level. The weekly RSI indicator supports the possibility of a recovery as it shows a significant bullish divergence, which is common before an uptrend reversal.
The 4-hour chart shows that the price of Altcoin NEAR is trading inside an ascending parallel channel after hitting new year lows at $1.15. This is a bearish pattern that in most cases leads to a collapse. However, NEAR’s price climbed above this pattern yesterday instead of falling. This is a bullish development as the invalidation of the bearish pattern usually leads to a strong upside move afterwards.

However, the 4-hours RSI indicator has moved into the overbought zone. Accordingly, this indicates that the rally is overextended in the short term. Therefore, the price of Altcoin NEAR could pull back to the channel’s resistance at $1.32 before surging towards the next resistance level of $1.53.
Indicators point to potential resistance for altcoin AVAX
Avalanche’s native cryptocurrency, Altcoin AVAX, had a significant breakthrough when it successfully broke the $13 hurdle. This hurdle had proven to be a significant challenge for AVAX bulls in the previous weeks and hindered their upward momentum. However, inspired by Bitcoin’s impressive rise to over $30,000, AVAX followed suit. He resolutely overcame this obstacle. This remarkable success instilled optimism in the AVAX community. It laid the groundwork for potential new gains.

Altcoin AVAX posted a notable 6.3% gain in a 24-hour period, pushing its price to $13.19. Also, the crypto has seen an impressive 16% gain over the past seven days, indicating increased momentum. However, despite these positive developments, AVAX still faces potential hurdles in its upward trajectory. The Relative Strength Index (RSI), a widely used indicator that tracks the balance between buying and selling pressure, has been consistently below the 50 mark since April, according to the latest AVAX price report.
What does it mean?
This indicates that selling pressure prevailed in the market during this time. Altcoin Avalanche has managed to overcome the previous hurdle. However, the fact that the RSI remains below 50 points to the potential for resistance as the uptrends face selling pressure. On the other hand, the coin’s Equilibrium Volume (OBV) indicator initially suffered a drop. However, he has since shown signs of improvement. OBV provides insight into demand for the cryptocurrency by measuring the cumulative volume of AVAX traded over a given period.

The recovery in OBV indicates an improvement in demand for Altcoin AVAX. According to Buan, this is a positive sign for its future performance. However, it is important to note that as the RSI approaches the 50 mark, it could act as an important resistance level for AVAX bulls. RSI’s closeness to this threshold indicates that a significant increase in buying pressure will be necessary to overcome potential selling pressure and sustain AVAX’s upward momentum.
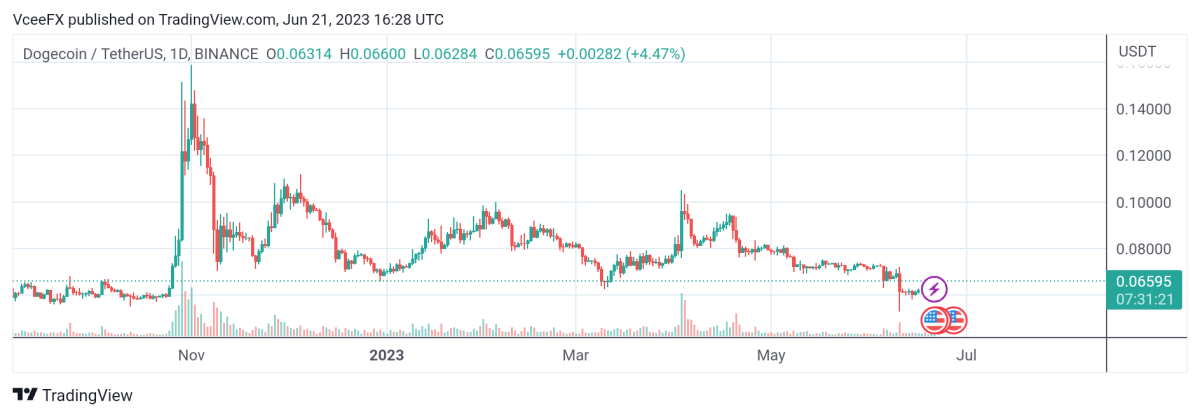
Will Dogecoin recover?
As of June 17, 2023, the transaction value of Altcoin DOGE was at $0.062569. During the previous week, its value fluctuated. After falling as low as $0.059487, it rose to $0.062845. Considering the last 30 days, DOGE has seen a 15.7% drop in its overall value. However, on the weekly charts, it registered a 5.5% growth, up 1.8% compared to the previous trading day.
Overall, Dogecoin’s positive performance in the recent period has aroused more confidence among investors. However, it is important to acknowledge that other altcoins also show comparable growth trajectories.
Altcoin FTM price approaches key resistance level
Phantom (FTM) has been underperforming for the past few months, losing almost all of its profits at the beginning of the year. However, the bulls seem to have regained control as the cryptocurrency price points to increased buying pressure. Altcoin FTM has exhibited bearish price action since April 18, adding to the coin’s negative market sentiment. However, the token’s price is bouncing. It is showing signs of recovery, gaining more than 15% in the last 24 hours.
FTM broke the $0.34 support level during the descent and dropped as low as $0.21 on June 10. Interestingly, FTM price formed an evening star candlestick on the daily chart, indicating a bullish reversal. And the price has been on the rise ever since. In addition to the evening star pattern, technical indicators also point to a bullish reversal.
Other indicators
For example, the daily Relative Strength Index (RSI) has broken out of the oversold zone, showing that bullish momentum is building. However, he has yet to confirm a trend reversal and his line has barely crossed above 50. An RSI reading above 50 usually indicates a bullish breakout is on the horizon. Accordingly, bears have the advantage when the RSI reading is below 50. Meanwhile, the daily Moving Average Convergence Divergence (MACD) line recently broke above the signal line, which is another bullish indicator.

Phantom seems ready to target the $0.34 price zone, which is currently expected to act as resistance. If FTM price gathers enough momentum and breaks this resistance level, it will likely reach the $0.54 level. Perhaps it will reach a new 2023 peak. On the other hand, if the resistance level remains strong, Altcoin FTM downtrend could continue. In this case, the token price could drop to a new year low below $0.1997.
Altcoin Lido Finance LDO continues to rise
In terms of price action, the Moving Average Convergence Divergence (MACD) remained positive. When this indicator is above the zero midpoint, it indicates that the short-term Moving Average (MA) is above the long-term Moving Average (MA). This means that Altcoin LDO will continue its upward momentum. In contrast, investors are willing to avoid short positions for now.

Altcoin LDO tends to stop its upside trajectory with a sell candle emerging around $2.02. Also, at the time of writing, the price has arrived at the top of the Bollinger Band (BB). With increased volatility, this means an overbought point. Therefore, a slight retreat is not far away. In addition to the price hike and staking, Lido’s revenue has exceeded $1 million in the past seven days. This was due to the 11.93% increase in Total Locked Value (TVL). In conclusion, the overall ecosystem of Lido Finance seems to be healthy. But technically, the gradual selling pressure points to a margin drop in LDO’s value.
Contact us to be instantly informed about the last minute developments. twitter‘in, Facebookin and Instagramfollow on. Telegram And YouTube join our channel!
Risk Disclosure: The articles and articles on Kriptokoin.com do not constitute investment advice. Bitcoin and cryptocurrencies are high-risk assets, and you should do your own research and due diligence before investing in these currencies. You can lose some or all of your money by investing in Bitcoin and cryptocurrencies. Remember that your transfers and transactions are at your own risk and any losses that may occur are your responsibility. Cryptokoin.com does not recommend buying or selling any cryptocurrencies or digital assets, nor is Kriptokoin.com an investment advisor. For this reason, Kriptokoin.com and the authors of the articles on the site cannot be held responsible for your investment decisions. Readers should do their own research before taking any action regarding the company, assets or services in this article.
Disclaimer: Advertisements on Kriptokoin.com are carried out through third-party advertising channels. In addition, Kriptokoin.com also includes sponsored articles and press releases on its site. For this reason, advertising links directed from Kriptokoin.com are on the site completely independent of Kriptokoin.com’s approval, and visits and pop-ups directed by advertising links are the responsibility of the user. The advertisements on Kriptokoin.com and the pages directed by the links in the sponsored articles do not bind Kriptokoin.com in any way.
Warning: Citing the news content of Kriptokoin.com and quoting by giving a link is subject to the permission of Kriptokoin.com. No content on the site can be copied, reproduced or published on any platform without permission. Legal action will be taken against those who use the code, design, text, graphics and all other content of Kriptokoin.com in violation of intellectual property law and relevant legislation.