
While Bitcoin and Ethereum prices have increased significantly in 2023, XRP Coin has been left behind. Price movements and metrics of the three cryptocurrencies show distinctly different trends. However, major cryptocurrencies Bitcoin, Ethereum and XRP are showing interesting profitability trends, according to on-chain analysis firm Santiment. Crypto analyst Valdrin Tahiri looks at the technical picture of three cryptocurrencies.
Most of the BTC, ETH and XRP Coin supply is in profit!
In a new tweet, Santiment stated that more than 80% of the current supplies of Bitcoin, Ethereum and XRP Ledger are in profit. We last witnessed this trend in March 2022. Bitcoin, ETH and XRP Coin are currently marking 83%, 84% and 81% of their supply as in-profit. In this context, Santiment shared the following:
Bitcoin (83%), Ethereum (84%) and XRPLedger (81%) have their respective sources at historically high-risk profit levels compared to their averages of 55%-75% dating back to 2018. Crypto could certainly still climb due to greater exposure.
BTC price prediction: Breaking out of the formation
Bitcoin price action is consistent with this bearish trend. The daily time frame shows BTC falling since reaching $48,970 on January 11, 2024. The decline caused a breakout from a rising parallel channel the next day. Bitcoin confirms the channel as resistance. The daily RSI supports the breakout.
Meanwhile, the daily RSI has formed a bearish divergence (green) at the highest level. This occurs when a price increase is accompanied by a decrease in momentum. Then, the RSI fell below 50 (red symbol) for the first time since October 2023 (green symbol). Signs suggest Bitcoin has reached a local top. If the decline continues, BTC is likely to fall 12% to the nearest support at $37,700.
Despite this bearish BTC price prediction, a retracement of the channel’s support trend line could trigger a 12% rally to the $48,000 resistance.
ETH price prediction: Altcoin consolidates above resistance
Unlike BTC, price action for Ethereum is not bearish. This is because ETH broke out of the $2,350 sideways area, which has sometimes served as both support and resistance since May 2021. Moreover, the price reached a weekly close above this level. Such a breakout above a key resistance area is an extremely bullish development. The fact that the RSI is increasing and has just entered the overbought zone legitimizes the upward movement. If the increase continues, it is possible for ETH to reach the next resistance at $3,500. This means an increase of approximately 40% from the current ETH price.

Despite this bullish ETH price prediction, a close below $2,350 would invalidate the ongoing breakout. Then, the price is likely to decline by 25% to the nearest support at $1,900.
XRP Coin price prediction: It is trending below resistance
While ETH has an upward trend, XRP Coin shows an uncertain trend. This is due to both price action and RSI data. Price action shows that the XRP Coin price has fallen below a descending resistance trend line since July. Recently, the trend line caused a rejection on December 28, 2023. XRP Coin price has not reached the trend line since then. While the price is still trading above the $0.54 support, it has almost returned to the level after a failed bounce. Additionally, the RSI is below 50. Most likely, the future trend will be determined by whether the XRP Coin price falls below $0.54 or breaks out of the trend line.
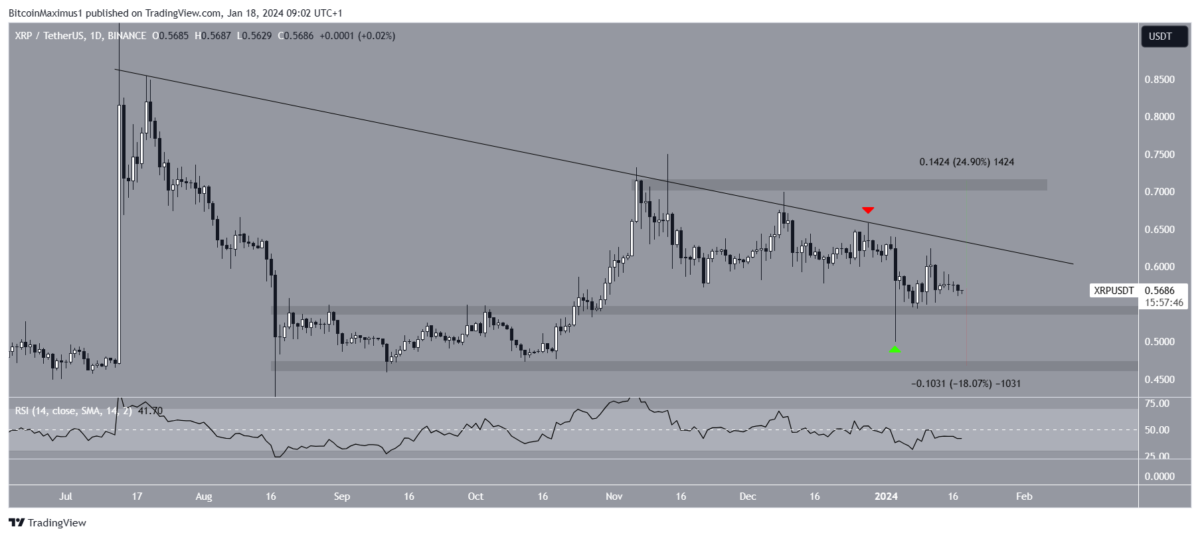
An XRP breakdown is possible, causing an 18% drop to the nearest support at $0.47. However, a breakout from the trend line is likely to initiate a 25% rise to the next resistance at $0.72.
To be informed about the latest developments, follow us twitter‘in, Facebookin and InstagramFollow on and Telegram And YouTube Join our channel!