
Bitcoin, which has experienced a decline with the inflation data announced last week, has increased by 10% in the last 1 week.
Bitcoin, which was traded at $ 22000 at the time of writing, has been in a price range of $ 4,000 for about a month. Bitcoin, which has risen by making high bottoms and high tops after the decline, yesterday reached the highest level of the last 1 month. 22,800 rose to the dollar.
Bitcoin Technical Analysis / 4-Hour Chart
Moving within an upward channel, Bitcoin continues to rise by making high bottoms and high tops. It is thought that the market structure will reverse if Bitcoin, which has $ 20,600 and $ 20,000 as current support, falls below $ 18,600. In the event that the market structure is bearish, it is estimated that the declines will become harder and seek new bottoms.
As the current resistance zone $23,000 and $25,500 have levels.
Many commentators and analysts think that the liquidity accumulated at the $23,000 level should be cleared and then a decline will follow. However, if the incoming drop stays above the 18,600 levels, Bitcoin will target new highs.
“Bear Flag” Occurs in the Diary
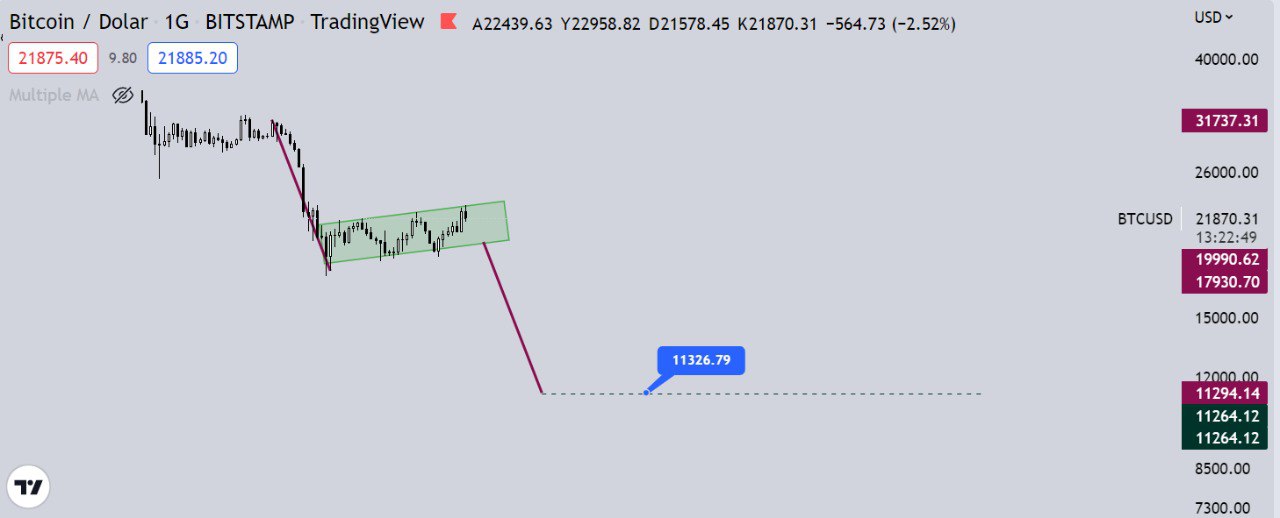
On the 1-Day chart of Bitcoin, the “Bear Flag” pattern appears. In this formation, a decrease is expected as much as the length of the previous decrease. Even if many commentators think that this chart will not work, it seems possible that we can see these prices with an extra interest rate hike by the US Federal Reserve or a big company’s announcement that it is selling Bitcoin.
- The data contained in the content is for informational purposes only. It is definitely not investment advice.