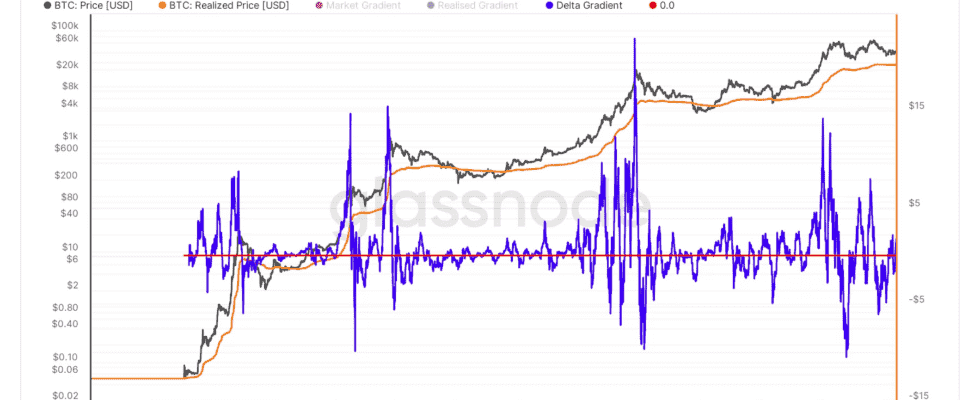
Market Realized Gradient Oscillator; It takes the realized price data, which is very important in onchain metrics, as a basis and examines the discrepancies by drawing a momentum graph from the difference with the market price.
You know about positive and negative RSI mismatches in technical analysis. While the price is making new lows, if the RSI lows do not adapt to this and are formed at higher levels, there is an expectation that the market will change trend in the buying direction.
Likewise, while the prices are making new highs, if the RSI peaks cannot exceed the previous one and remain below, there is an expectation that the market will change the trend in the direction of selling.
Market Realized Gradient Oscillator; It does this by examining the discrepancies between the realized price and the actual price on the onchain side.
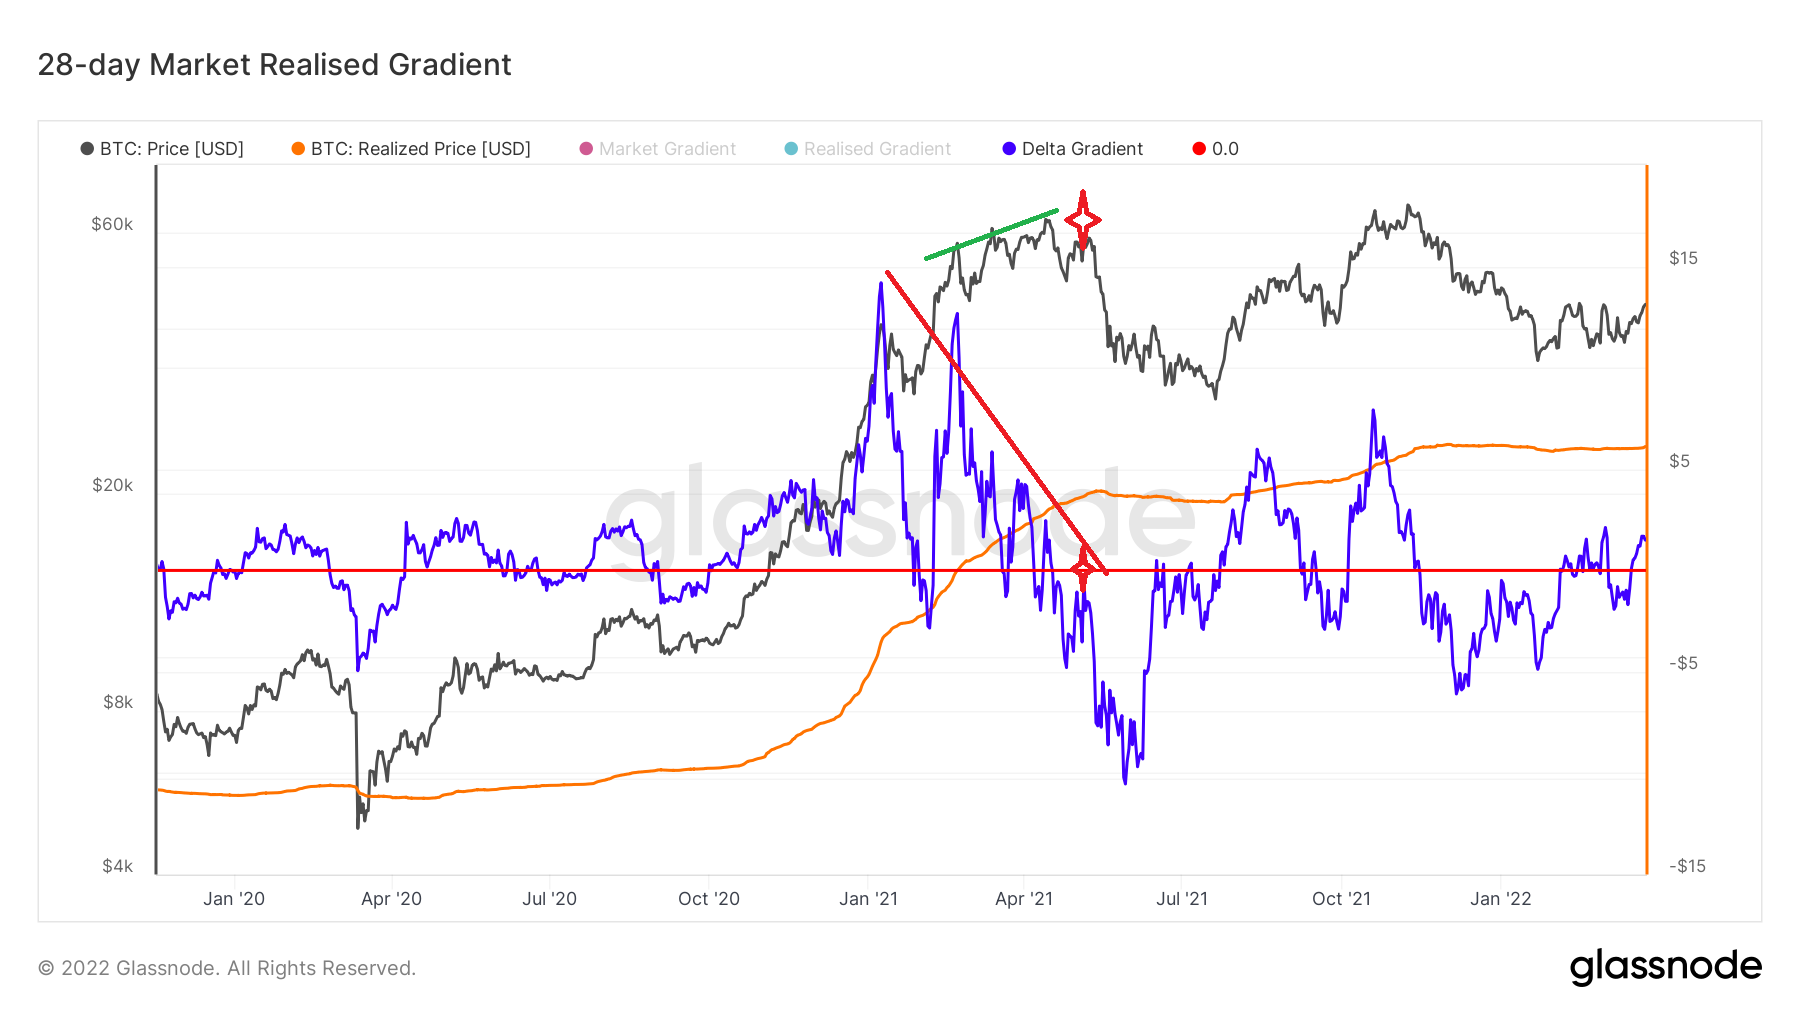
You see the 28-day version in the metric above. Let’s look at 2021. We clearly see that the price peaks are constantly making higher peaks, but the MRI (Market Realized Gradient) indicator is making falling peaks.
In other words, the momentum has gradually decreased and a sell transaction should be made after the red line you see in the middle is crossed and a clear idea is taken that no new peak can be made in the positive region. We can see one of the best examples between January and May 2021. For a long time the momentum fell screaming.
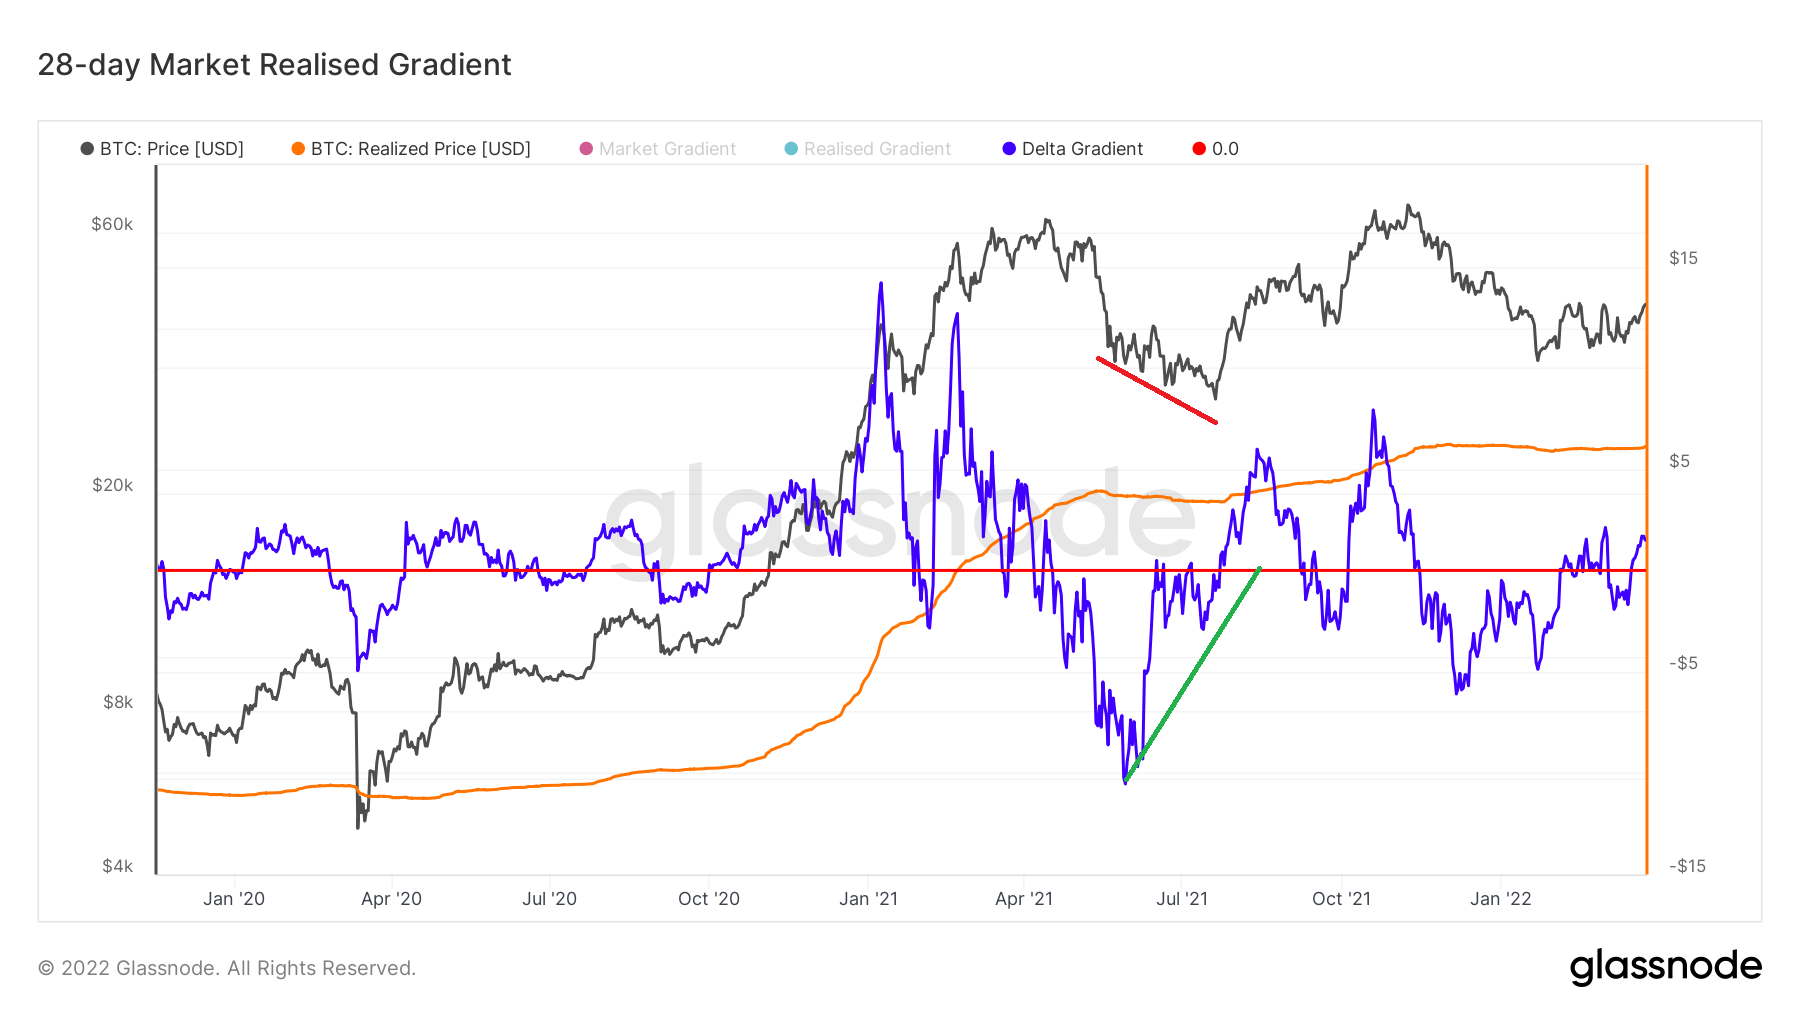
We see another example between May and August. While the price continues to make new lows, MRI is making rising lows and a breakout occurs at the point where the middle line you see in red crosses into the positive zone.
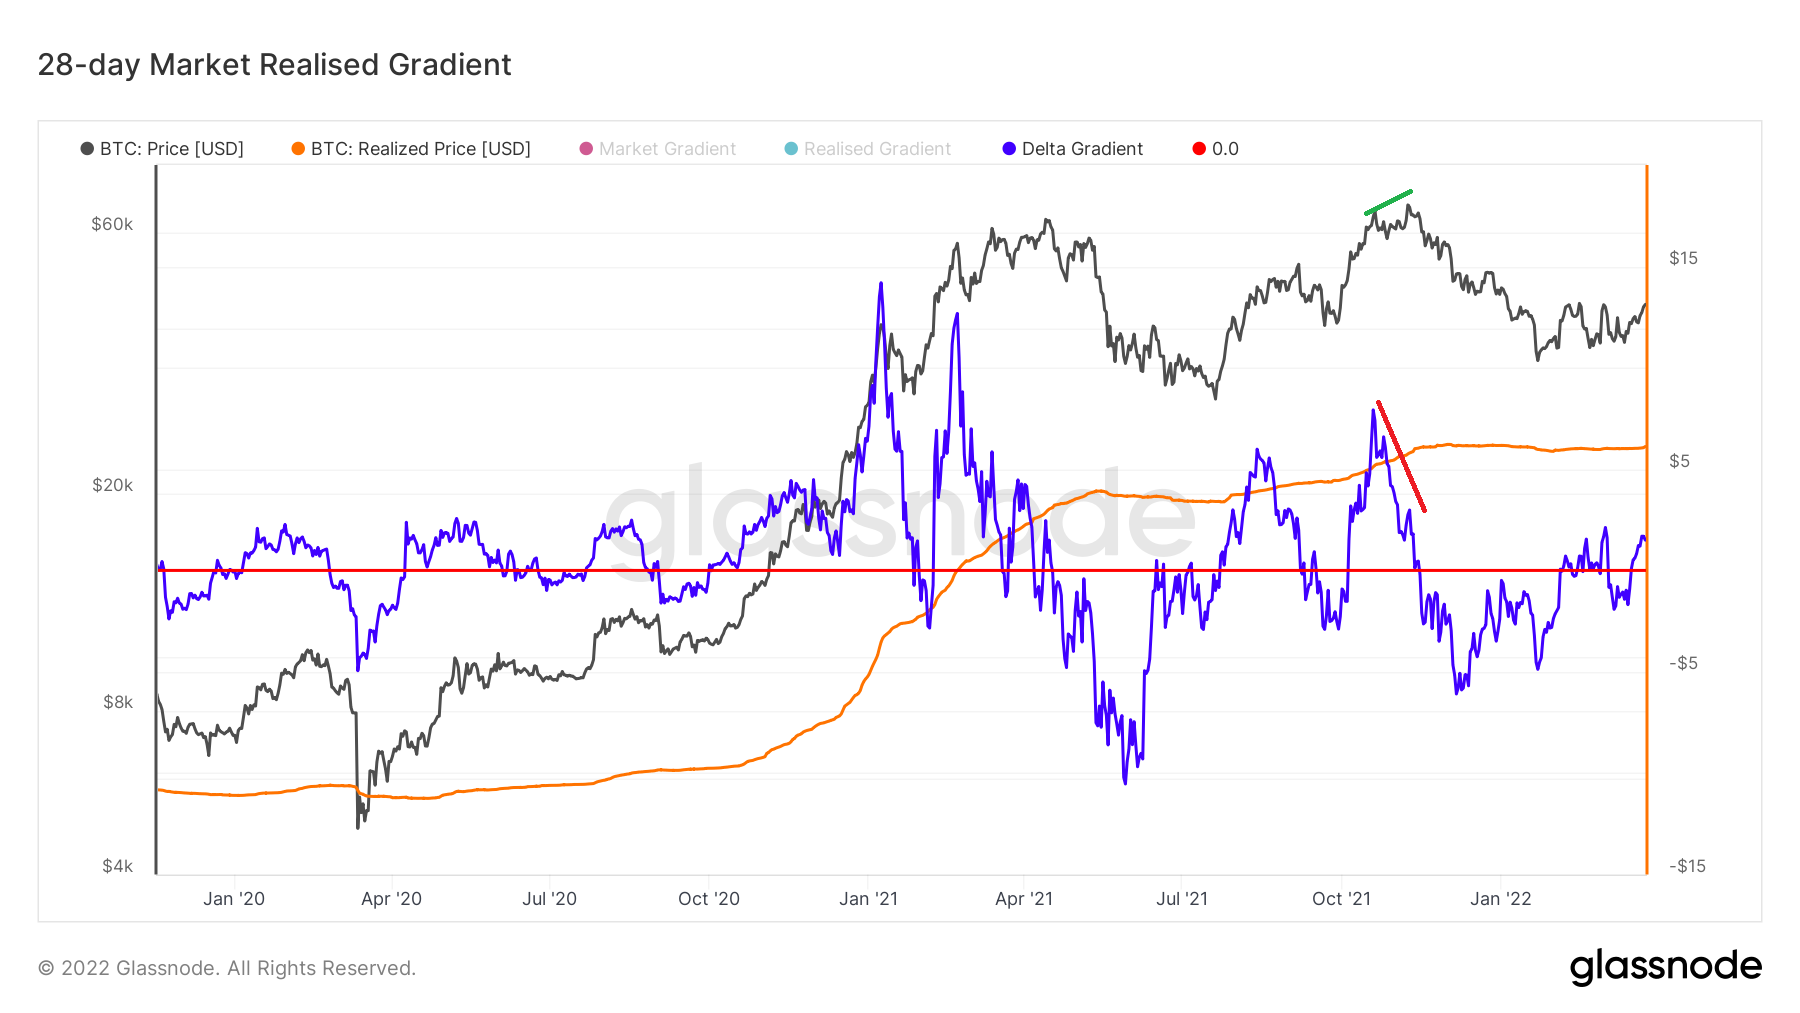
Another example comes from the 69K peak we did last October-November. In the chart above, we can see that the price is moving to a new high, while the MRI is moving to a lower top.
So Where Are We Now?
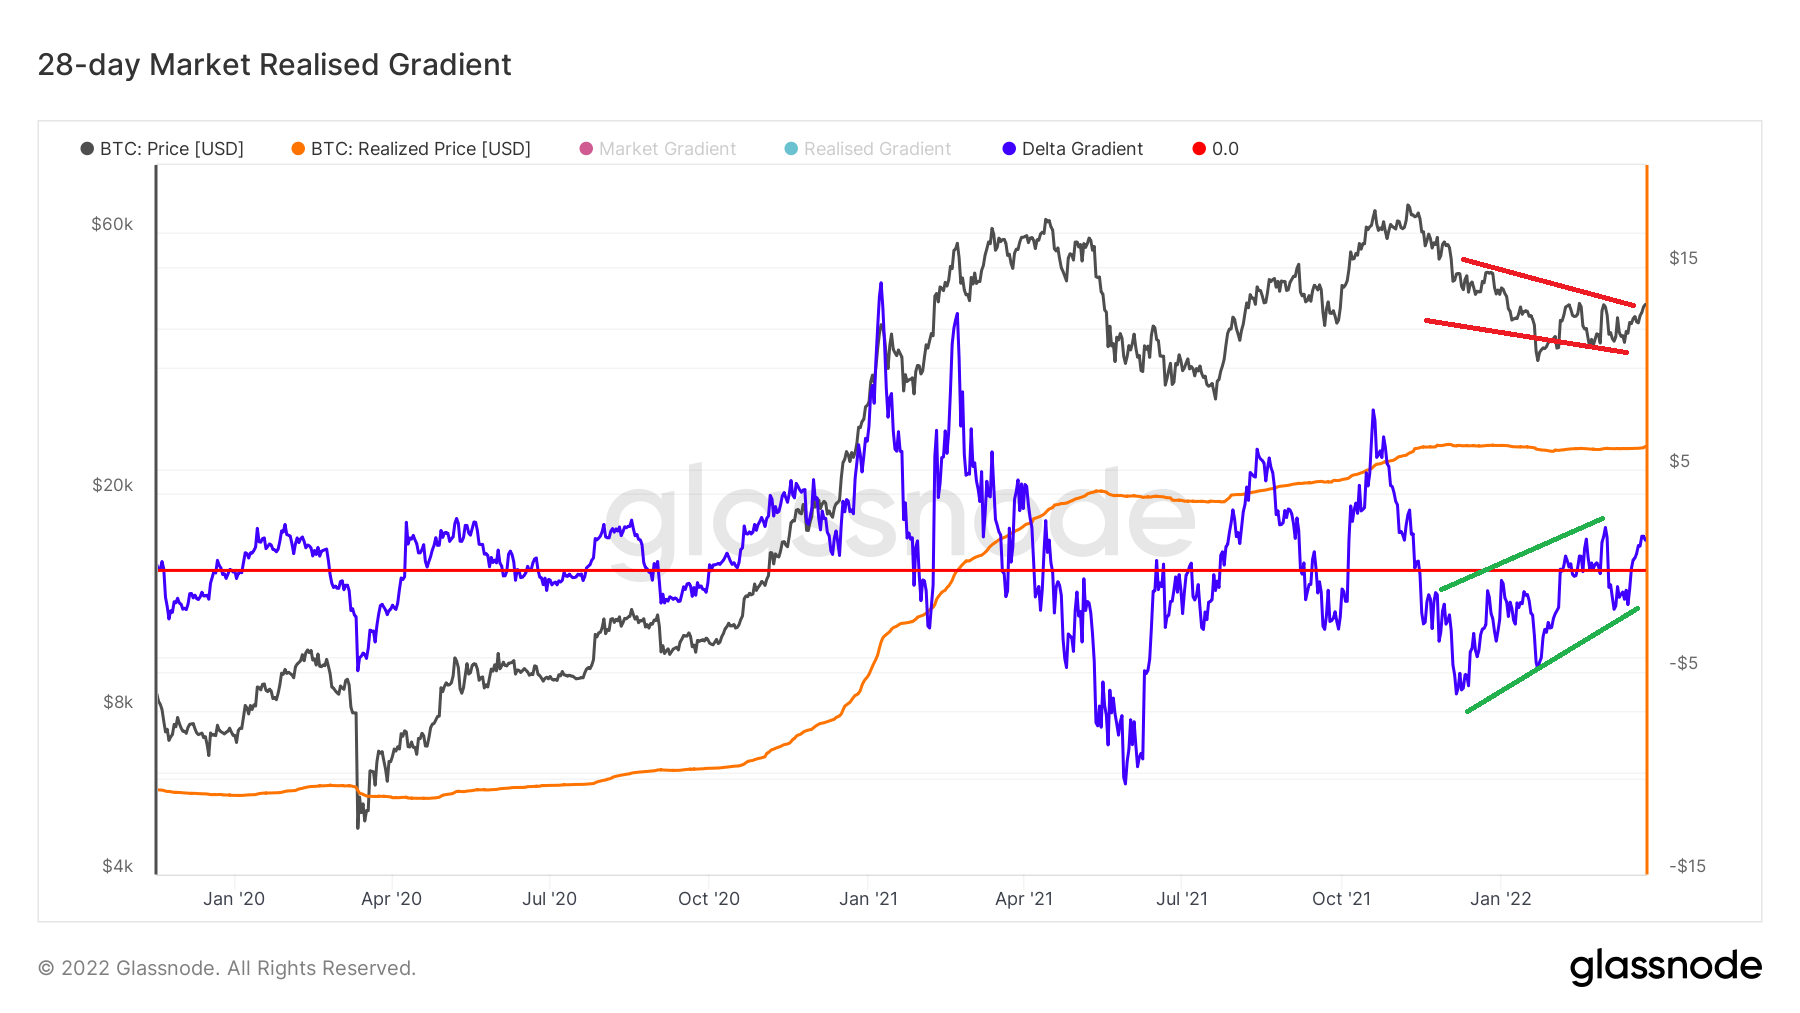
We’ve known for a long time now that the price is making falling lows, but we’re seeing MRI’s moves in the form of new rising lows and highs. Of course, the hill it will make at the moment is important, but the fact that we crossed the red line you see in the middle and went to the positive side and that we are in a position to make a new MRI peak again is positive in terms of momentum.
Finally, if we look at the 140-day MRI for long-term prediction:
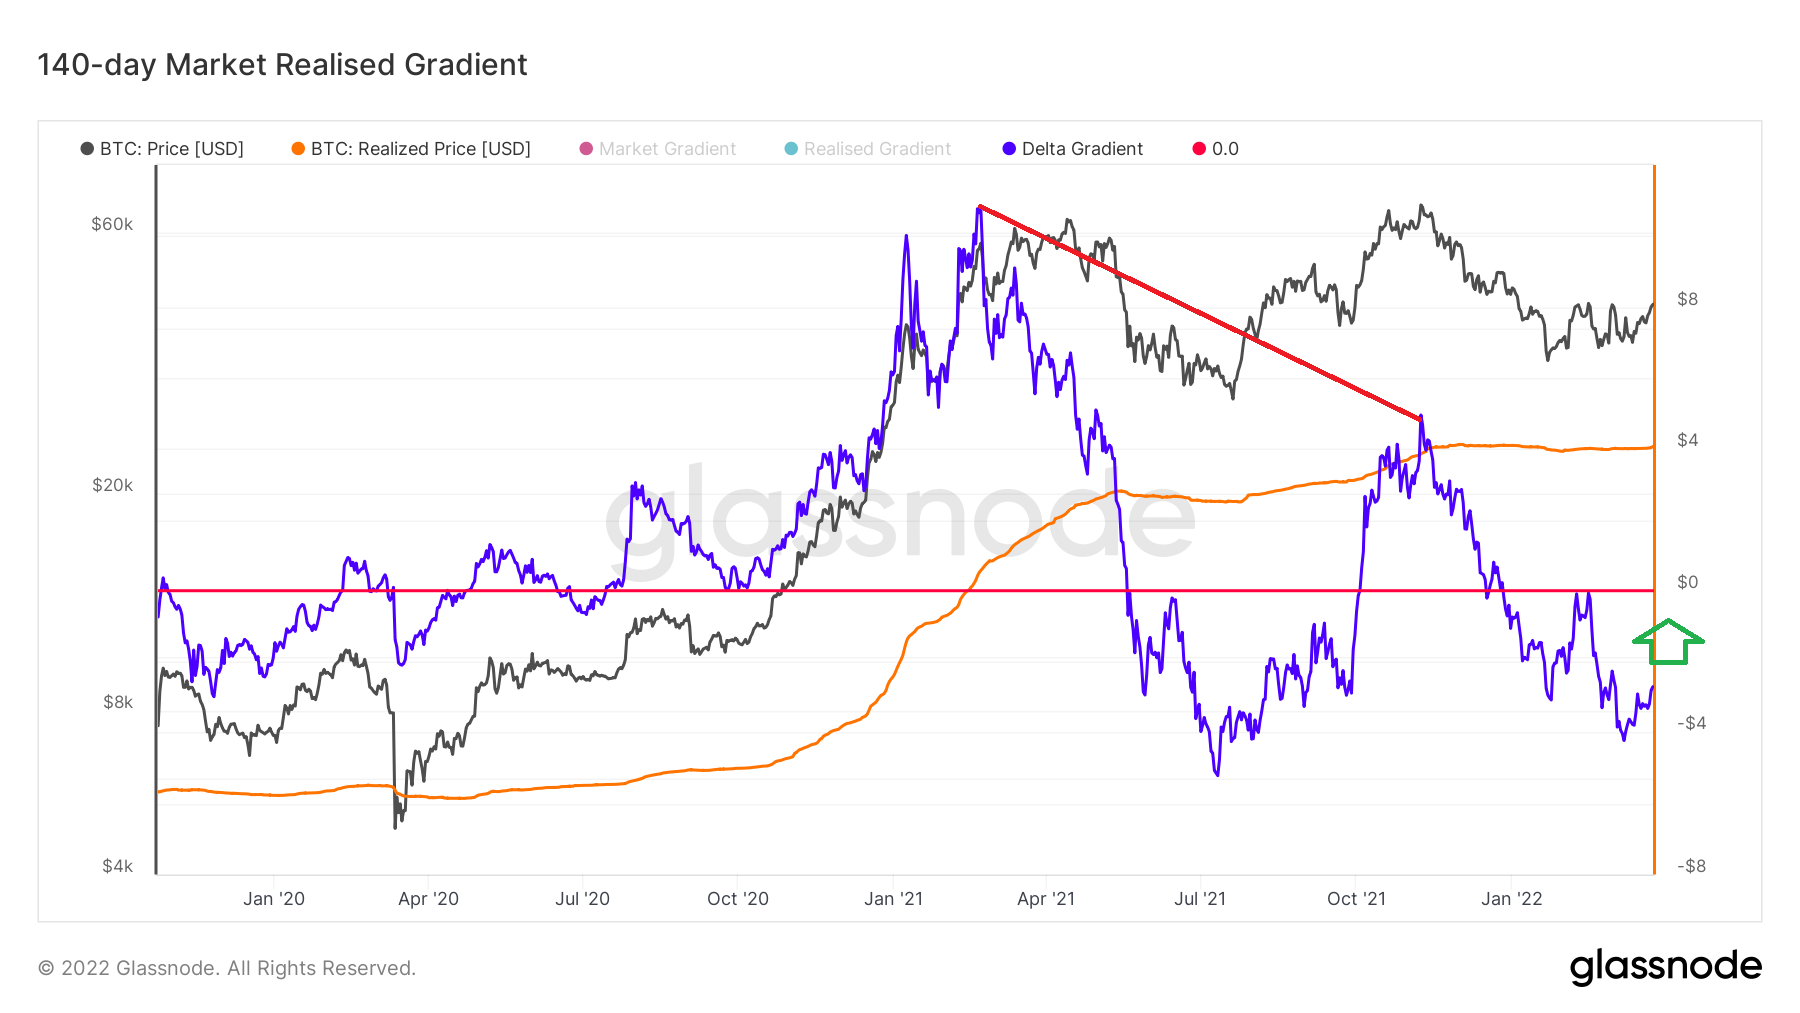
As you can see in the metric, we can see the peak mismatch between the peak we made at the beginning of 2021 (February 2021) and the last peak (November 2021). Therefore, if a new hill is to be made, it will be very important where it will show us on MRI.
First of all, we need to get out of the negative area by crossing the red line in the middle and move to the positive area, and then we need to look at its relationship with the last hill made. The 140-day data may work for very cautious investors, but it will also add a long-term forecast to us. It is still early for him, but we can see that we have started an upward movement from the bottom, at least in terms of momentum.