After the high inflation data in the USA, Bitcoin markets, which rose to $ 44,000 levels, relaxed. The good reactions in altcoins, which have been in a downtrend for a long time, made the investors and those who had the opportunity to buy from the bottom smile.

Just when everything was going well, now the death-cross possibilities started to confuse them.
What is death cross?
Death-Cross: The short-term average crosses the longer-term average from top to bottom. This intersection is considered important as a sign of great weakness.
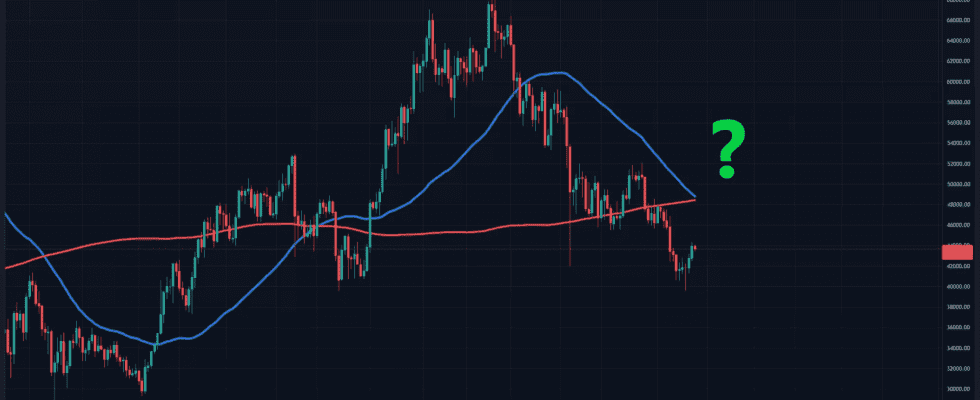
When we look at the chart of Bitcoin, we see that the 50-day average is preparing to cut the 200-day average from top to bottom.

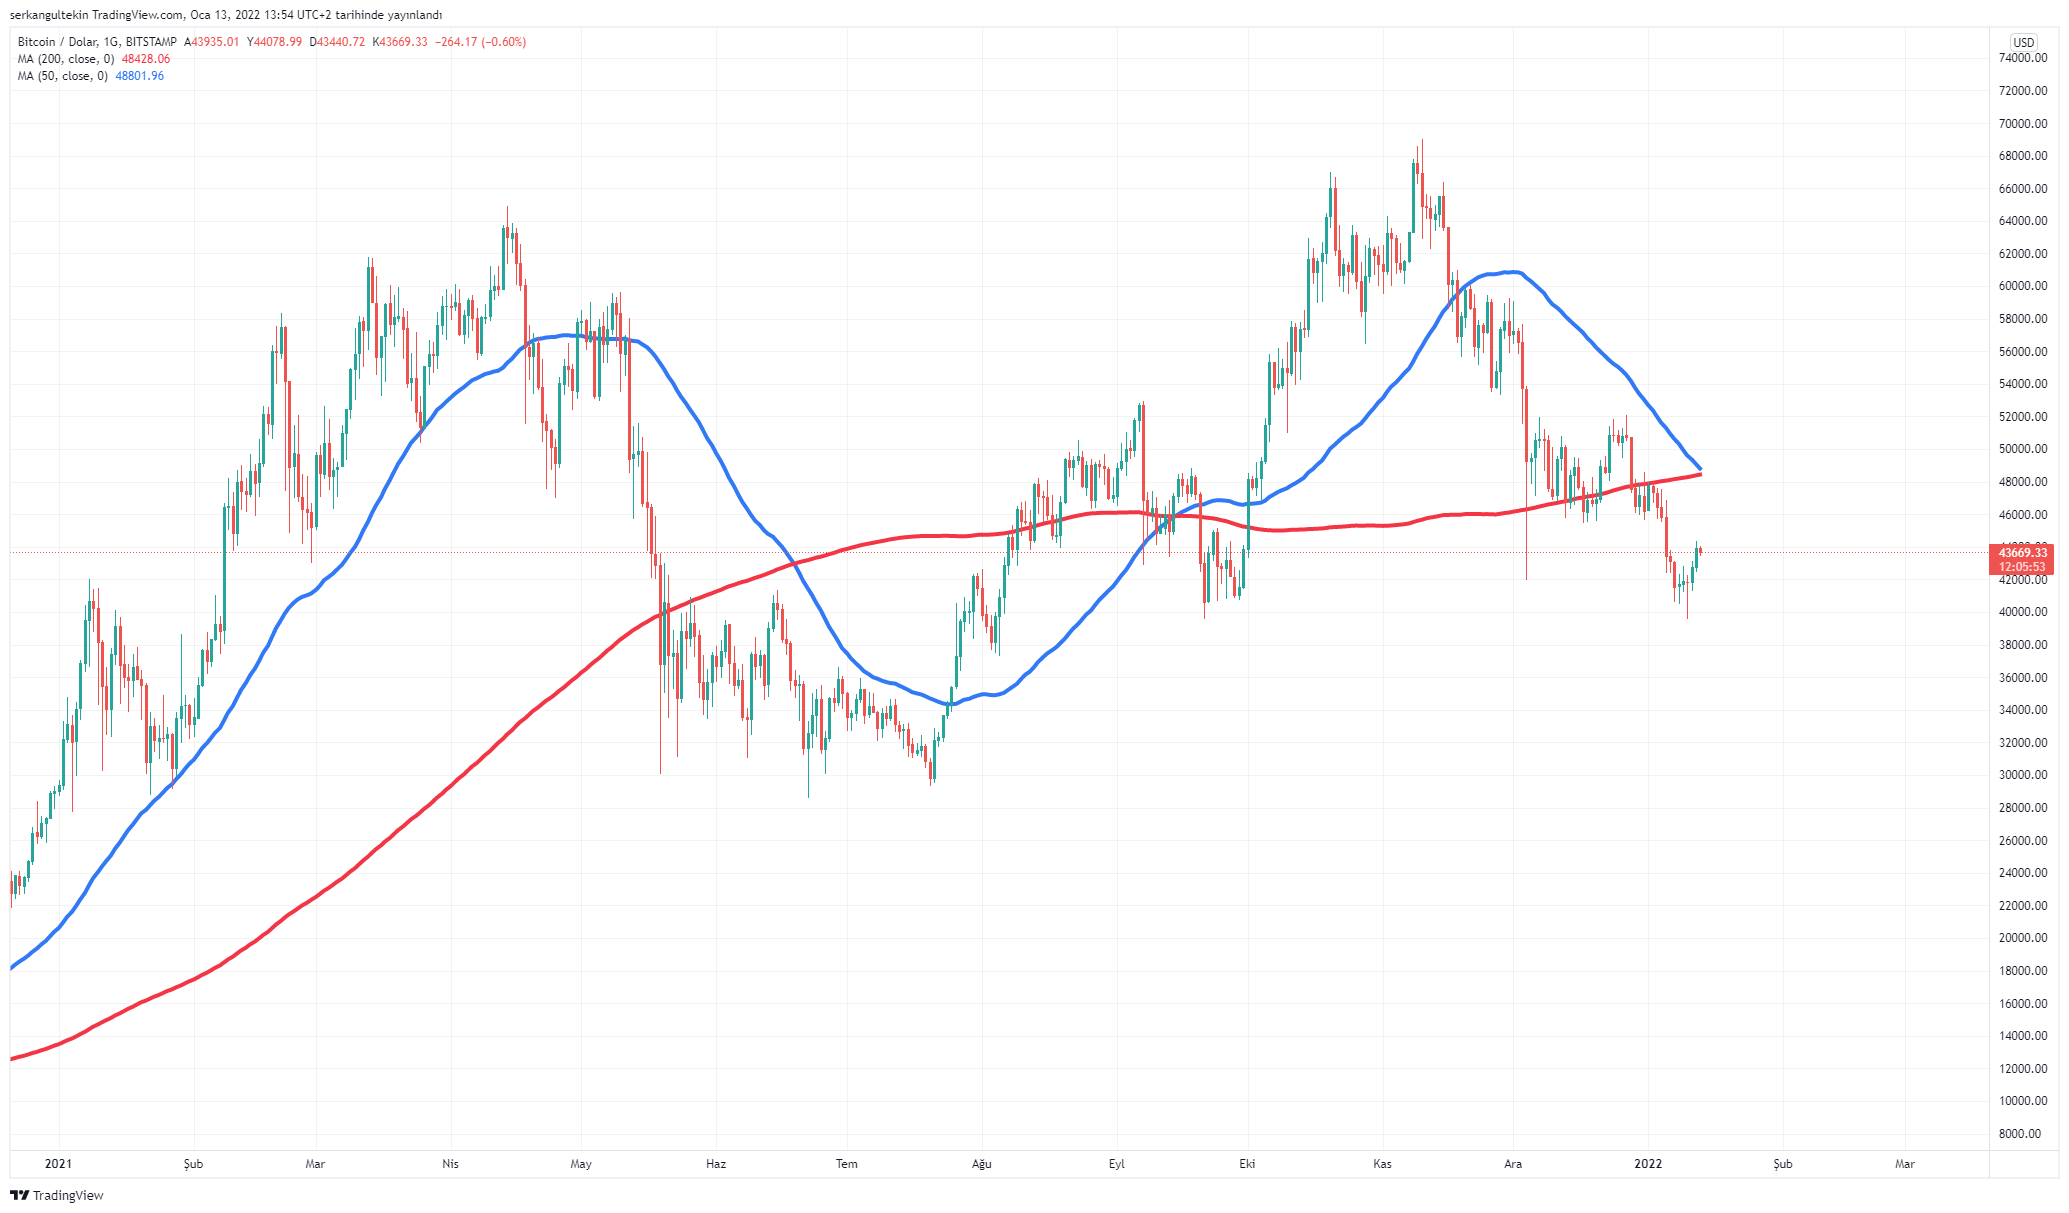
Before a similar move in June, we see that the decline started and the price fell from $40,000 to $28,800.
Does This Intersection Trigger a New Fall?
Commenting on the death intersection, popular analyst Lark Davis said; “We have seen 8 death crosses in BTC history. 4 of them confirmed that we are almost at the bottom. But the other 4 preceded sales of 30%, 60%, 61% and 65%.”
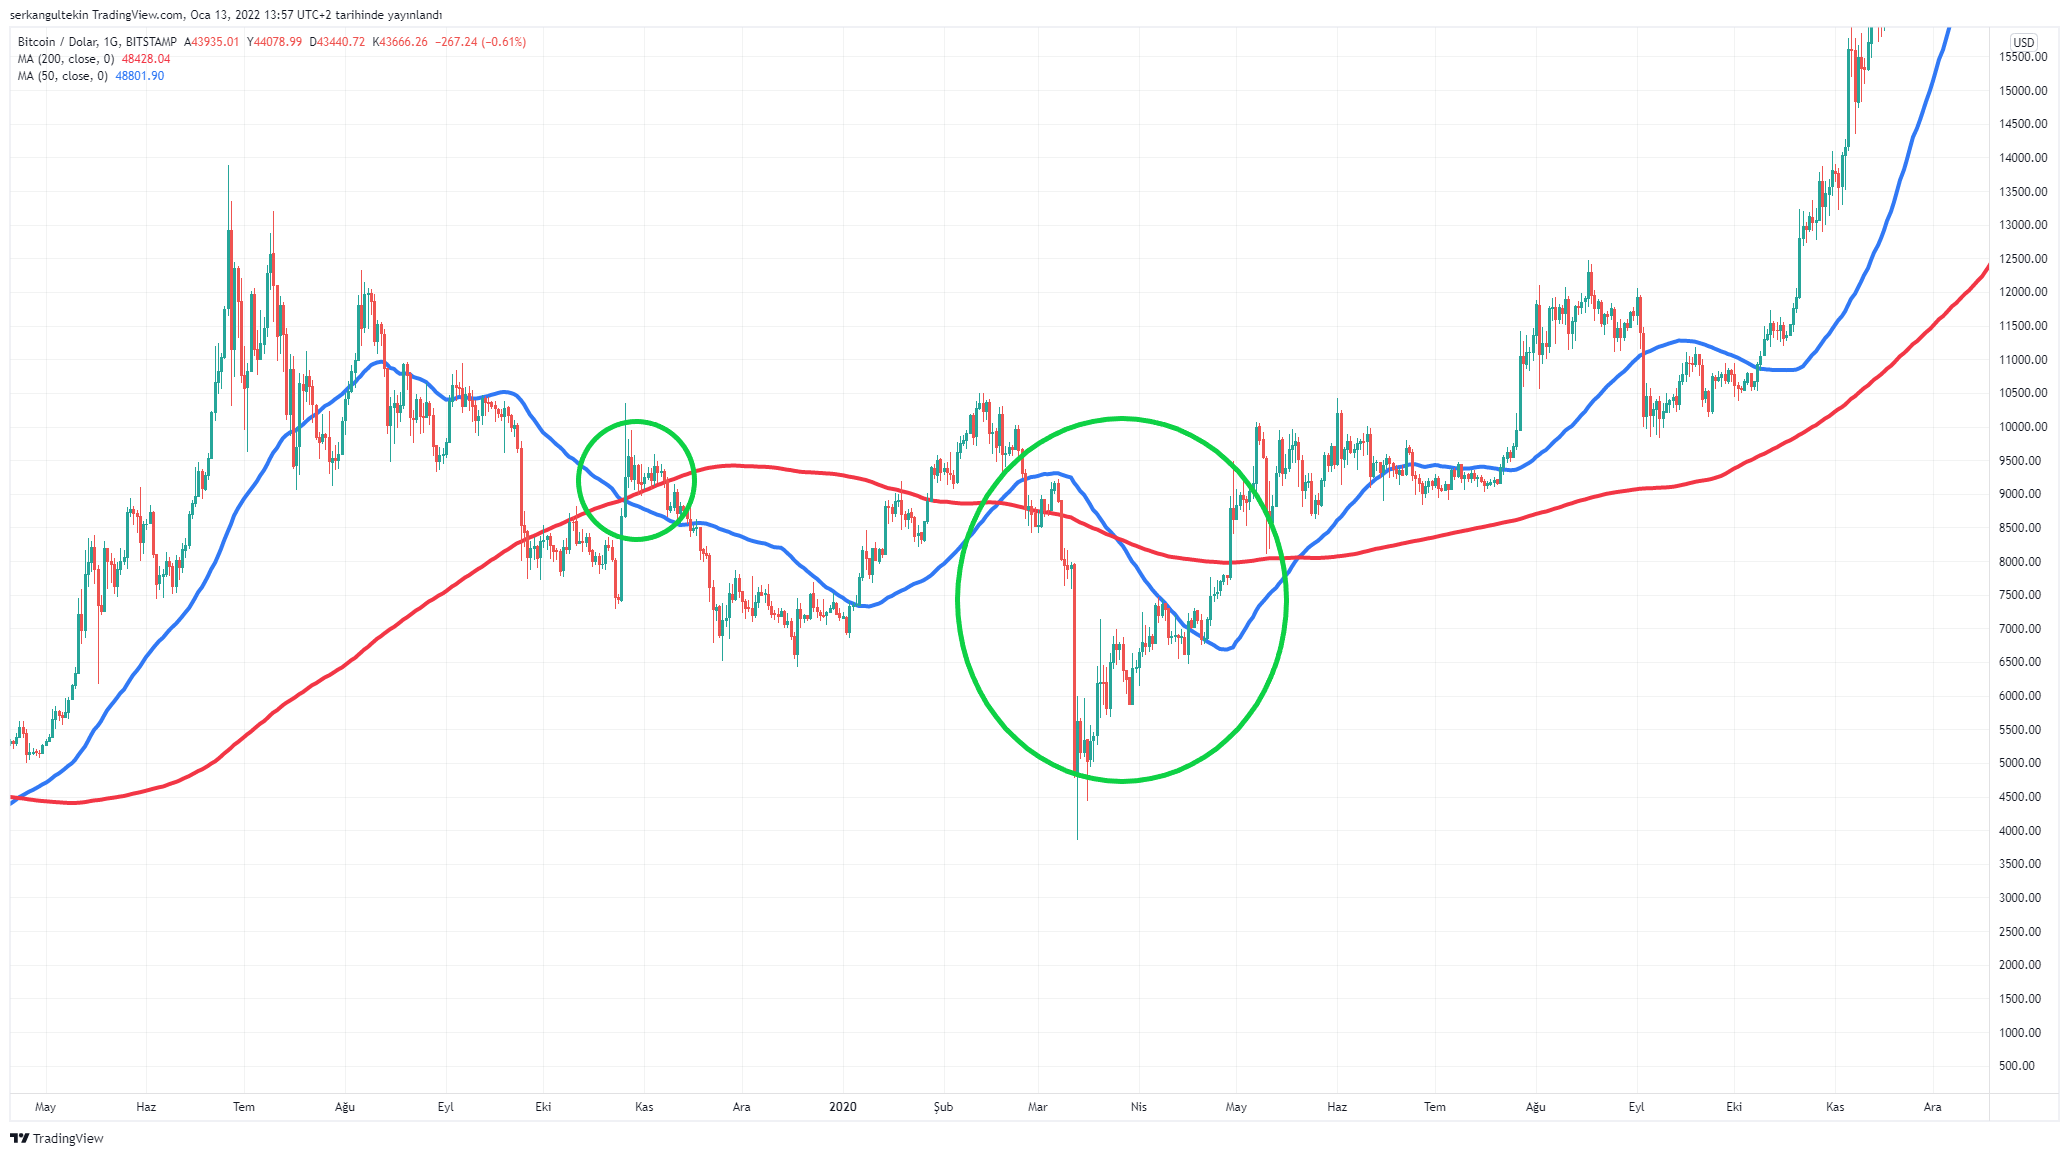
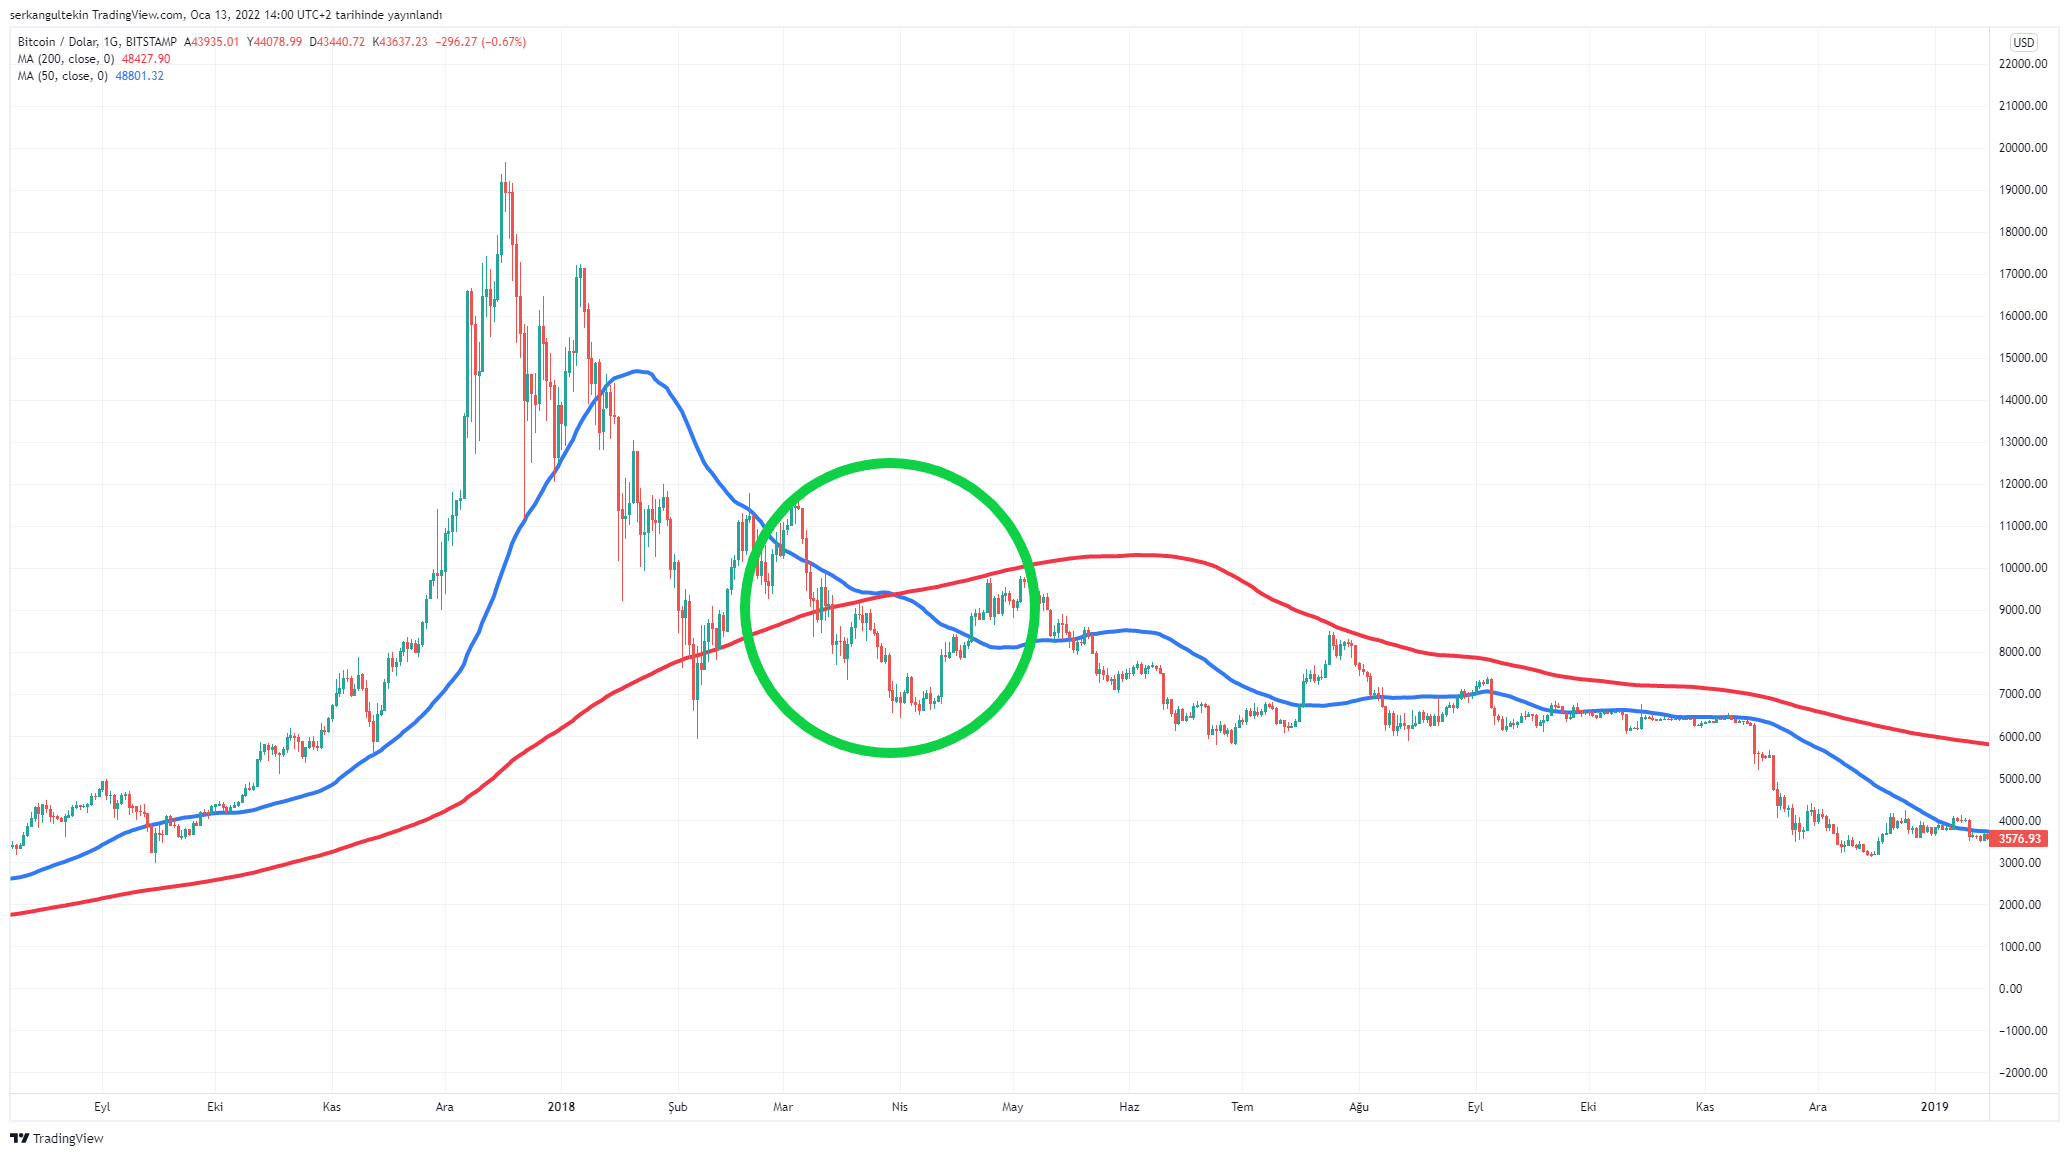
When we examine the previous death intersections, we see that it triggers hard sales when it comes in local hills.
However, in the current chart, we cannot see a Bitcoin price that has received a serious reaction from the bottom and has risen. Therefore, we consider that selling pressure from this death cross is less likely. Looking at the previous movements, although this crossover triggers a large sale, its effect will be short-lived.