
The price of Bitcoin, which has been stuck between $ 19,000 and $ 21,000 in recent weeks, has dropped to $ 18,650 with its decline in the evening today.
The fear and greed index, which measures market sentiment, is in a state of extreme fear with 22 points as Bitcoin’s sharp fall paints the entire market red.
Long-standing correlation with US stocks Bitcoin (BTC) Undoubtedly, the selling trend of US indices was effective in this decline.
The US stock markets, which were positive at the opening of the day, closed the day with a negative.
- Dow Jones – 0.55%,
- Nasdaq –0.72%,
- S&P500 – 0.41%
On the other hand, while the US dollar index (DXY) is trading at $110,250 with +0.39% change, the highest levels of the last 20 years meet us. Undoubtedly, this is one of the biggest factors that triggered the fall of BTC.
How is September in Bitcoin in General?
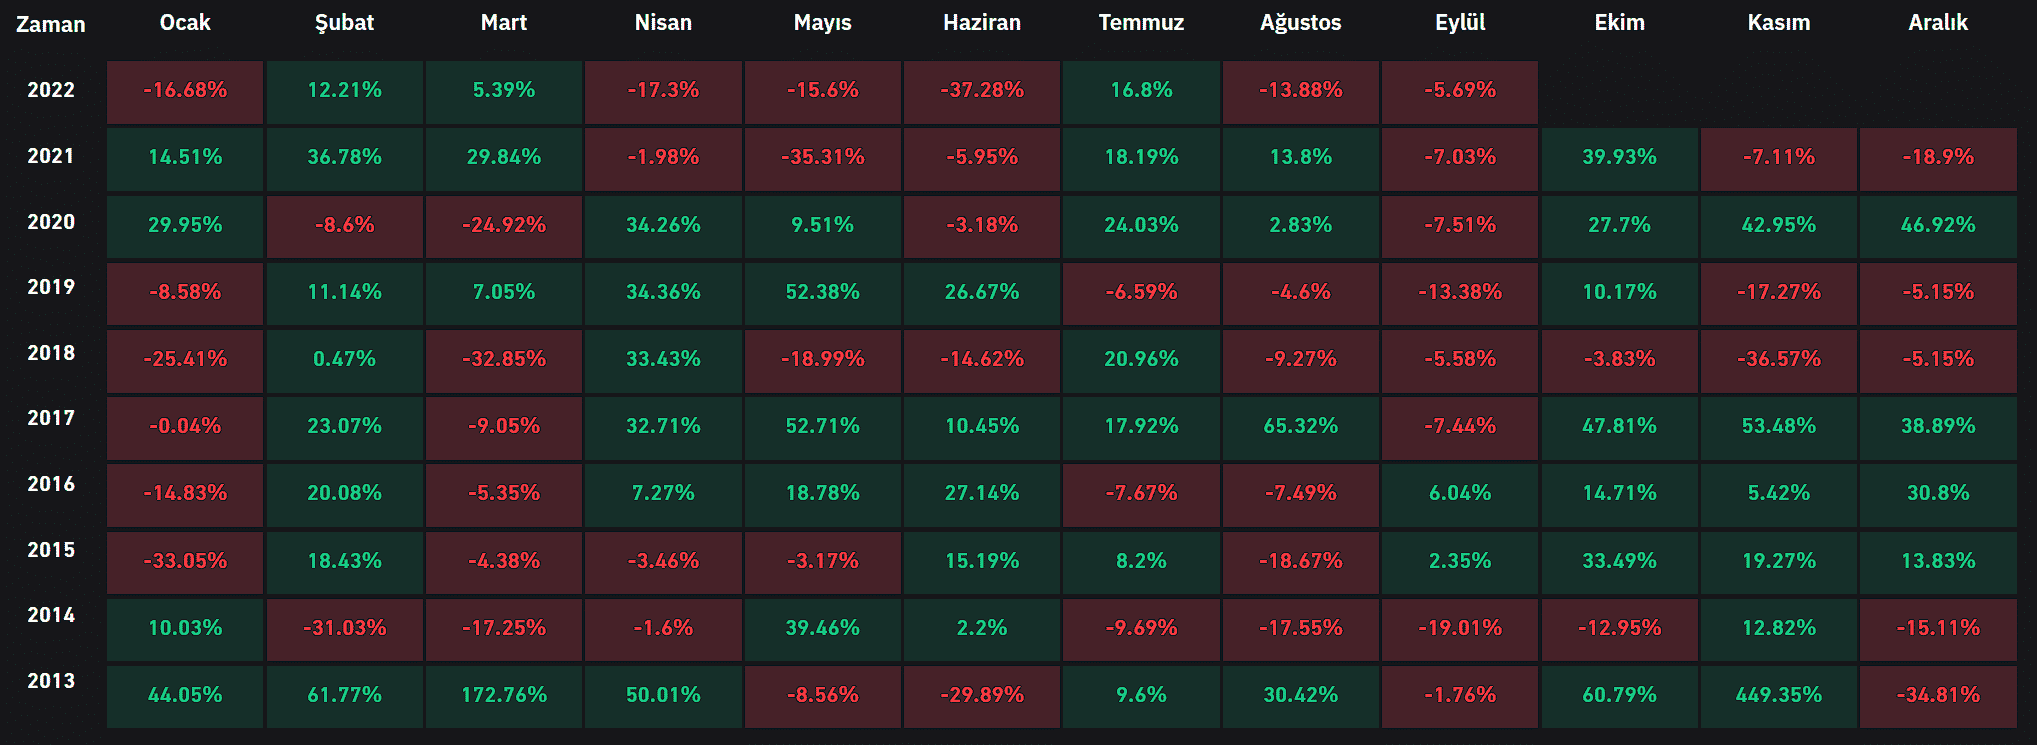
When we examine the historical data, it is seen that Bitcoin has always moved in a downward direction in September since 2017. For BTC price, which usually closes this month “red” even during bull periods, the “September” month seems to have started from the first week.
Whether this bad luck in September will continue or not will be determined by the data from the USA. The US inflation data to be announced on September 13 and the Fed’s interest rate decision to be announced on September 21 will undoubtedly determine how September will end.
For exclusive news, analytics and on-chain data Telegram our group, twitter our account and YouTube Follow our channel now! Moreover Android and iOS Start live price tracking right now by downloading our apps!