

The cryptocurrency market has been dealing with high volatility for some time now. dogecoin is also among those that have had its share of this high volatility, and has been trading between $0.655 and $0.566 for about five weeks. The resulting narrow gap pattern is an important proof that DOGE holders are quite indecisive, but it also represents a familiar technical setup for traders.
Important Details:

- A break of the $0.65 level could take it as high as $0.0756.
- The daily RSI slope has moved into the bullish zone.
- The 24-hour trading volume on Dogecoin stands at $617.8 million, which means a 192% increase.
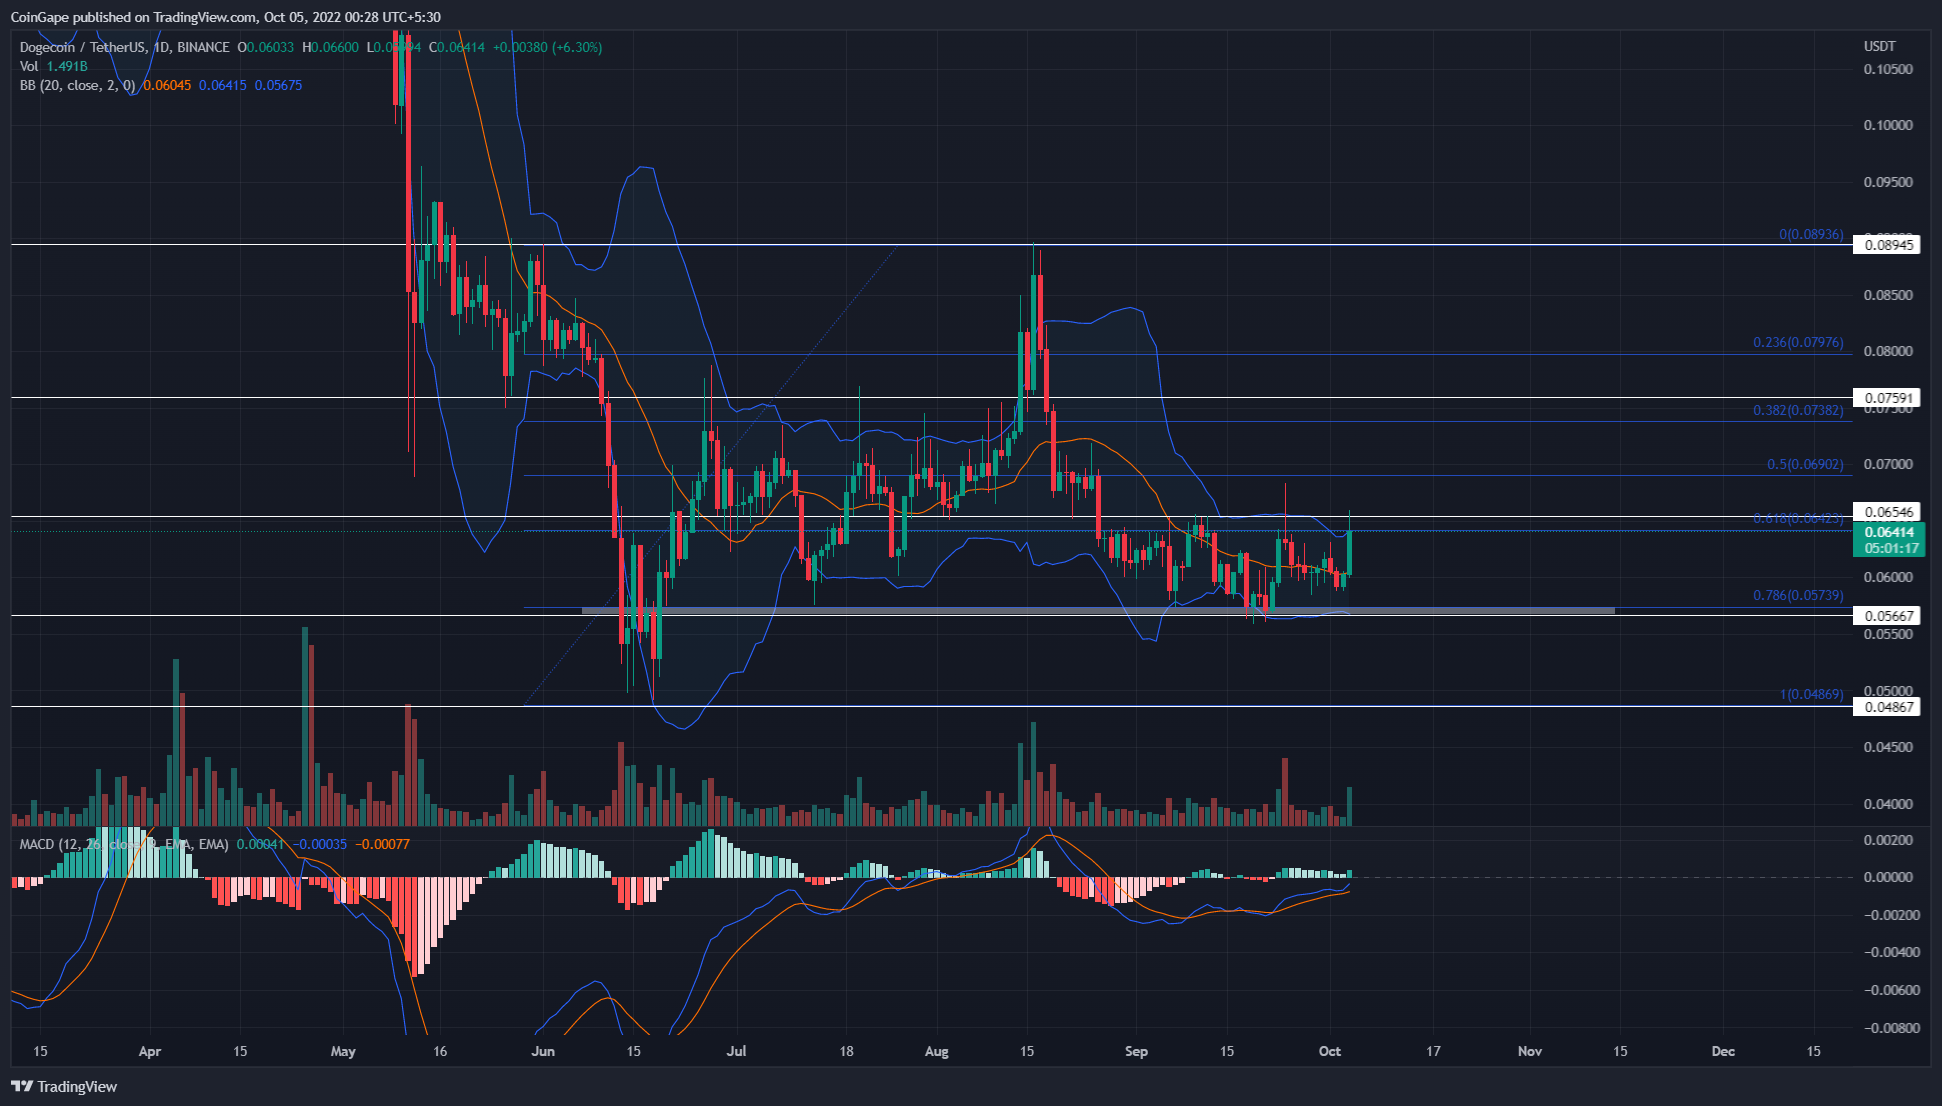
daily technical chart, Dogecoin priceIt continues to show a rectangular pattern in which the . The altcoin has also repeatedly tested extreme levels for this pattern, showing that traders are actively responding to these levels.
As Koinfinans.com previously stated, Elon Musk’s offer to re-purchase Twitter also created speculation in the Dogecoin community. You can read the speculations and much more by clicking here. As a result, meme coin price is up 8% today and retested the $0.655 resistance.
“With a strong rise in volume activity, buyers are trying to reclaim this monthly resistance. Closing of the daily candle above the $0.655 resistance will provide a higher base for buyers and continue the previous recovery.”
A rally after this breakout could push prices as high as 16% to $0.76. Conversely, if Dogecoin price stays below the $0.655 resistance, the ongoing consolidation will take a few more sessions.
Technical Indicator:
- EMAs: Rising token price retraces 20 and 50-day EMAs.
- MACD indicator: A bullish divergence on the MACD and the signal line for sideways price action indicates increased bullish momentum. Also, these lines could soon jump above the neutral line and provide additional confirmation for the bulls.
- Bollinger band indicator: The sudden movement in price coincides with the upper band of the indicator, which creates an additional barrier against buyers. A retest of this level previously triggered a new bear cycle within this rectangle.
Dogecoin Price Intraday Levels:
- Spot rate: $0.0639
- Trend: Lateral movement
- Volatility: High
- Resistance levels – $0.065 and $0.076
- Support levels – $0.056 and $0.048
You can follow the current price action here.
Disclaimer: What is written here is not investment advice. Cryptocurrency investments are high-risk investments. Every investment decision is under the individual’s own responsibility. Finally, Koinfinans and the author of this content cannot be held responsible for personal investment decisions.