
XRP The price managed to reclaim a very important price zone and confirm it as support for the past 3 weeks. This creates room for the price to rise further.
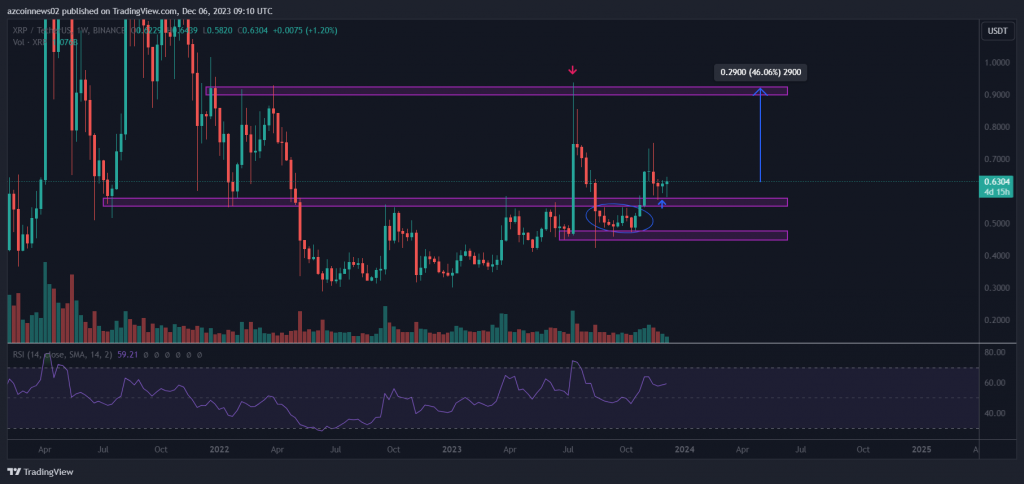
XRP price has declined since being rejected by long-term resistance at $0.91 during the week of July 10-16. This move caused the price to fall below the critical price zone of $0.56, which has served as support and resistance since July 2021.
However, the price has managed to hold the key level of the uptrend at $0.47 since the beginning of 2023. This means that the trend is still upward and any decline is considered a correction. As a matter of fact, XRP price later recovered and broke above the key $0.56 region with a major bullish candle in the week of October 30 – November 5. It then confirmed this area as support for the past 3 weeks.
This indicates that the previous pullback was just a divergence (green ellipse) and is usually followed by strong upward moves. The weekly RSI is above 50 and sloping upwards, supporting further upside potential.
If the uptrend continues, the key resistance zone to watch lies at $0.91, which is 46.06% higher than the current price.
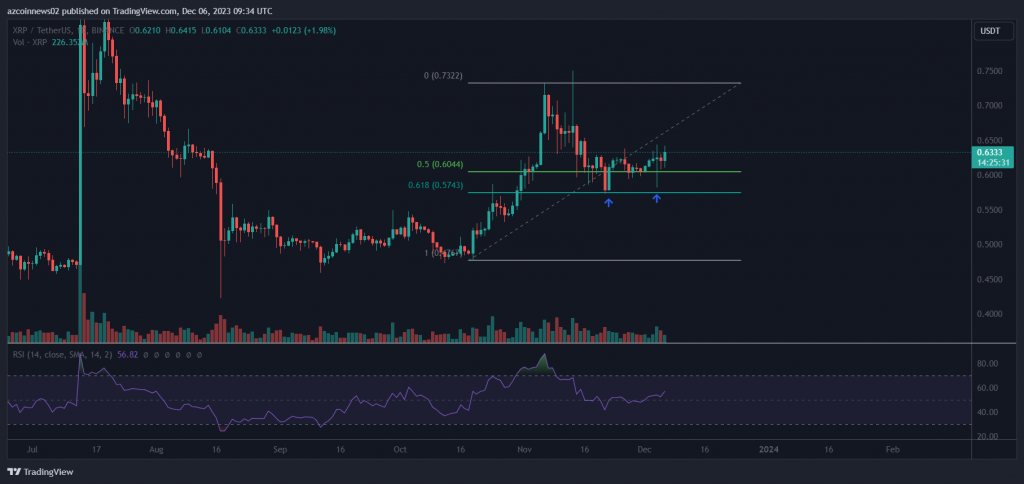
The daily chart shows XRP price bouncing off the 0.5-0.618 ($0.57-0.60) Fibonacci retracement support zone of the latest rally (indicated by blue arrows).
According to Fibonacci retracement theory, after a significant price change in one direction, it is expected to retrace part of the previous price level before resuming the initial trend. The bounce from the Fibonacci retracement support zone 0.5-0.618 indicates that the previous decline was just a correction and the uptrend will likely continue soon.
The daily RSI supports this possibility as it has reclaimed the 50 level and is sloping upwards. Therefore, the price may rise to the nearest horizontal resistance zone at $0.73 in the coming days.
The most likely scenario shows that the XRP price will continue to rise in the near future. While the immediate target is at $0.73, there is a potential to reach $0.91.
This bullish view will be invalidated if the price breaks and closes below the 0.5-0.618 Fibonacci retracement support zone at $0.57-0.60 on the daily time frame.