
Polkadot (DOT), which is described as the killer of Ethereum (ETH), which immediately follows Bitcoin (BTC) in terms of its features in the crypto money market, has risen rapidly with the good news that came yesterday.

5 years after the vision of a heterogeneous multichain framework was first outlined in the Polkadot Whitepaper, parachains are now ready to launch on Polkadot. Motion 118, to schedule the first auctions, has passed council & now gone to public referendum.https://t.co/8pt3aT4vO3
— Polkadot (@Polkadot) October 13, 2021
As of yesterday, the launch date has been announced for Parachain (parallel chain), the Polkadot version of the long-awaited and recently popular multichain on the Polkadot network.
The launch of Parachain, which is expected to increase the network capacity of Polkadot, is set for November 11 after the council vote. DOT gained more than 20% as investors who heard this news quickly hit the BUY button.

Towards New ATH After Golden Cross…
DOT, which started to decline from the high of $38.77 in mid-September and then found support around $26, continues to rise after the Golden Cross on the daily chart.
The news of Parachain, which came after this formation, which was formed while the price was falling and pointing to the rise, gives signals that the rise will continue. DOT, which has not yet entered the overbought region in the RSI indicator, is expected to continue to rise again after minor regressions in the short term.
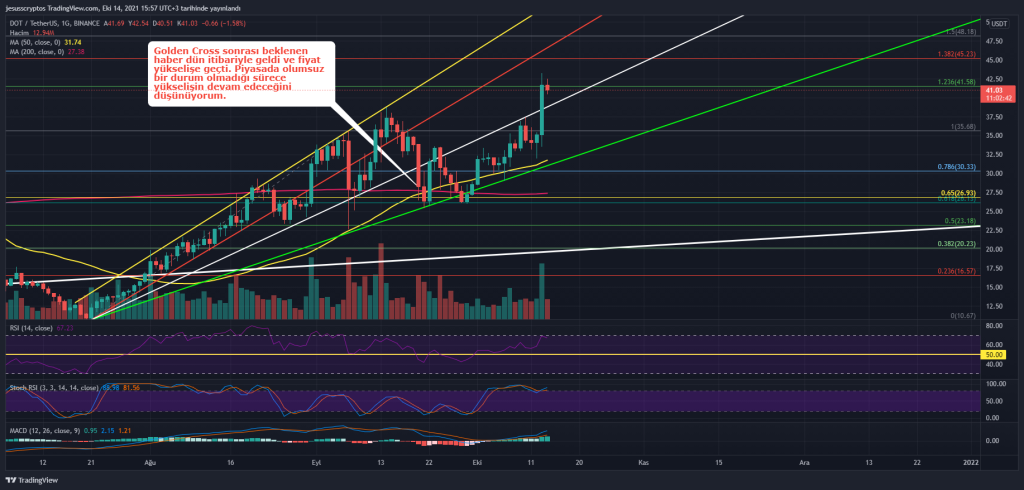
After yesterday’s rise, the DOT price, which was stuck at the $41.58 resistance, seems to be buying strongly, although it has experienced minor declines. If it closes above the white trend line and $41.58, it is thought that the rise of DOT will continue and it will bring $51 as the new ATH level in the first place. In case of a decline in price, a buy-side position can be taken with a close stop at $38 and $35 gradually.
Support Is Maintained Even With The Setback!
Having severely broken the ascending channel formation on the 4-Hour chart, DOT continues to protect this level by turning the $41 level to support.
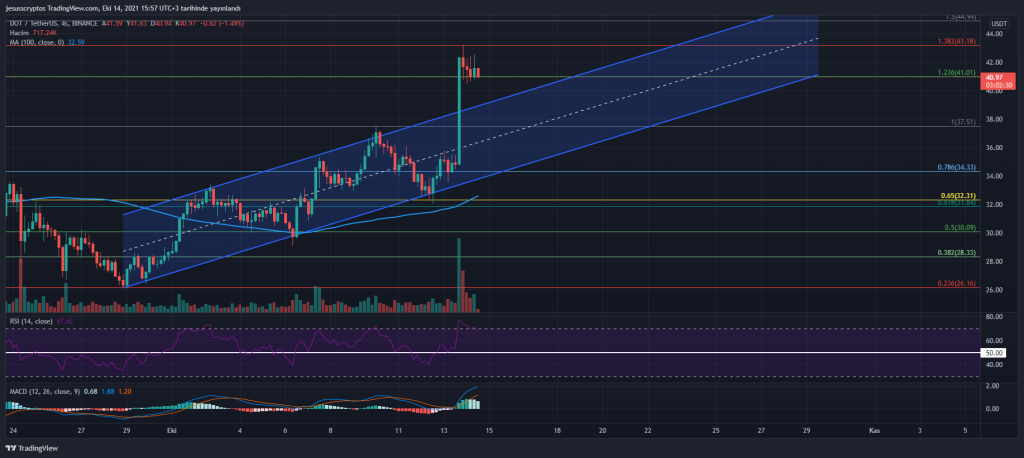
DOT, which is seen to be filtered down by the selling behind the long green candle, is thought to form a bullish flag formation that signals bullishness. In this situation, where the RSI indicator is slowly calming down, the formation is targeting the previous ATH level of $ 49. On possible retracements, the ascending channel or the horizontal support level of $37.51 is expected to support the DOT price, while losing this level could bring $32.
* The above does not constitute investment advice, please take your own investment decisions yourself.