
Bitcoin (BTC), which is advancing by following the monthly targets of Plan B, one of the famous names in the crypto money world, approached the October target of Plan B to $ 63,000 with the rises it experienced this week.

The leading cryptocurrency recorded a 15% rise in the last week, seeing $62,933 on Binance yesterday, while altcoins started to follow this rise with some loosening of the dominance. BTC, which left a 10% daily candle after rumors appeared in the market yesterday that the SEC approved the BTC ETF, finds buyers at $ 60,800 as of the publication time.
First Target in New ATH in BTC Coming to the Resistance Area!
Starting the day with a decline and a red candle, BTC started to decline with profit sales and weekend effect after rising to the resistance area corresponding to the previous ATH level.
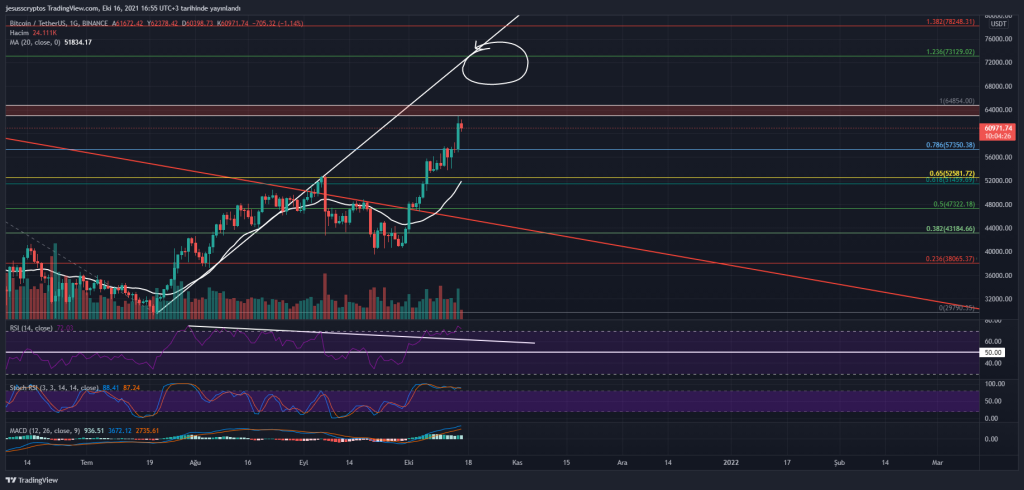
The news of the ETF, which was seen to have a 10% effect in the first place, allowed BTC to prick the resistance area in the $62,960 – $64,854 area. It is seen that the RSI indicator, which came to the level of 74 with this needle, fell back to the level of 70 with today’s regression. At this point, the $57,350 level is expected to show an important support during the decline to BTC, which is seen to be rejected for now.

While the leader, who could not pass this resistance area in the first place, is expected to move horizontally and pass this resistance after this regression, new ATH targets are spoken in the market. According to the fibonacci retracement applied on the chart, BTC’s first resistance point and the new ATH can be expected to be $73,219 on this new ATH path. However, before starting this way, the $57.350 and $52.581 levels are considered to be the safe buy points in BTC, and closings below the MA20 ($51,820) level are considered to be a stop sign.
Short Term Fall Support!
Shouldering the market as before, BTC started to relax after raising the overall market value of cryptocurrencies to $2.5 trillion.
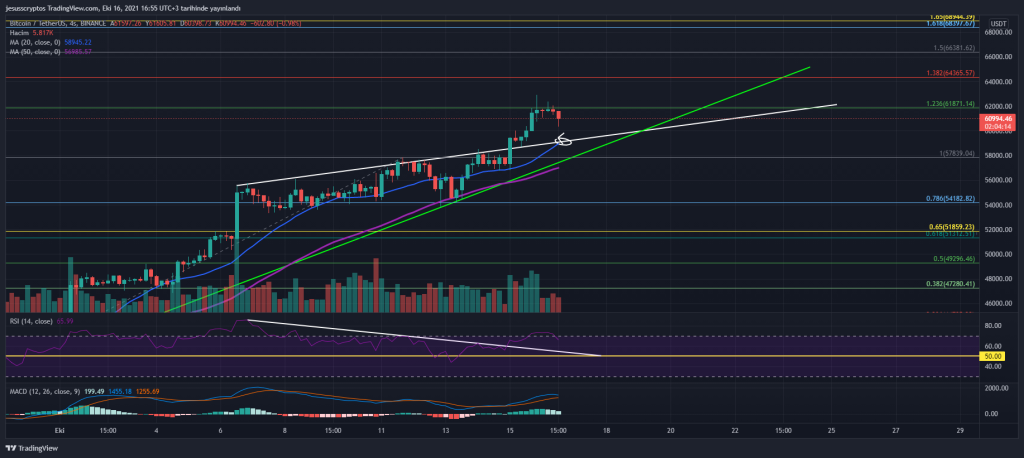
BTC, which was seen to be stuck with resistance on the 4-hour chart, as in the same daily chart, made a move towards the white trend line that it had broken on the upside. BTC, which could not close candles above $ 61,871, which meets the price as a resistance, is expected to be supported at $ 58,950, which corresponds to both the white trend line and the MA20, in this decline. Also, if there is a rapid decline, it is thought that a needle can come to $ 57,840.
If BTC manages to close candles above this resistance level, $64,365 – $66,381 are seen as intermediate resistances. At the end of these resistances, there is a short-term target range of $68,397 – $68,944 on the 4-hour chart.
* The above does not constitute investment advice, please take your own investment decisions yourself.