The latest breaking news about Polkadot, one of the wide-ranging blockchain projects connecting multiple private blockchains to a unified network, has been in Frankfurt Securities for ETP (exchange-traded products) transactions of Polkadot (DOT) and Cardano (ADA) in the past few days. It was approved by the Stock Exchange.

In addition, another news this month took its place on the agenda with the announcement of Polkadot (DOT) Parachain Astar Network 100 Million Dollar Incentive and Support Program.
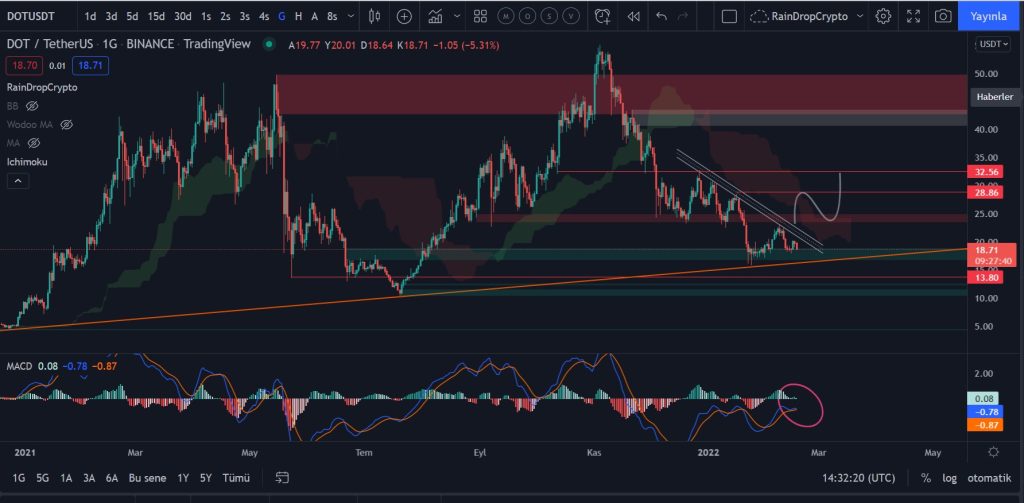
So, how did the effect of the updates and news that came out this month reflected on the price?
In general, we can see in the chart below that the signals coming from both MA and Macd, which are important indicators used as trend follower, are weak and below the averages.
With the effect of the news, it received a reaction of about 9% from the $ 18 support level on February 15, but continued to decline with the withdrawal again.
Here, we encounter the major trend zone from December 27, 2020 and the support zone around $16.
In the worst case scenario, if there is no buyer pressure in this region and daily closes below this region, sub-trend support levels can be followed.
As a good scenario, the buyers are strong in the region around this trend, and the upper resistance levels can be targeted with the breakdown of the downtrend region from December 2021, that is, with daily closings above 23 and 24 dollars.
To summarize; We can see that the downward trend in the general direction of the market continues and there is an instant reaction with the effect of the news. The main trend zone here is important, and the actions of the buyers should be monitored in line with the volume increase and the impact of the upcoming news.