Popular meme coin Shiba Inu It failed to break key resistance levels and is currently experiencing downward pressure. This move is characterized by a descending triangle formation on the charts, indicating potential further declines.
Typically seen as a bearish signal, a descending triangle indicates that sellers are more aggressive than buyers, leading to increasingly lower highs. Currently, SHIB is facing resistance along the upper trend line of the triangle, while support has formed near $0.0000237. If this support level fails to hold, there is a strong possibility that SHIB will drop towards the next important support at $0.000021.
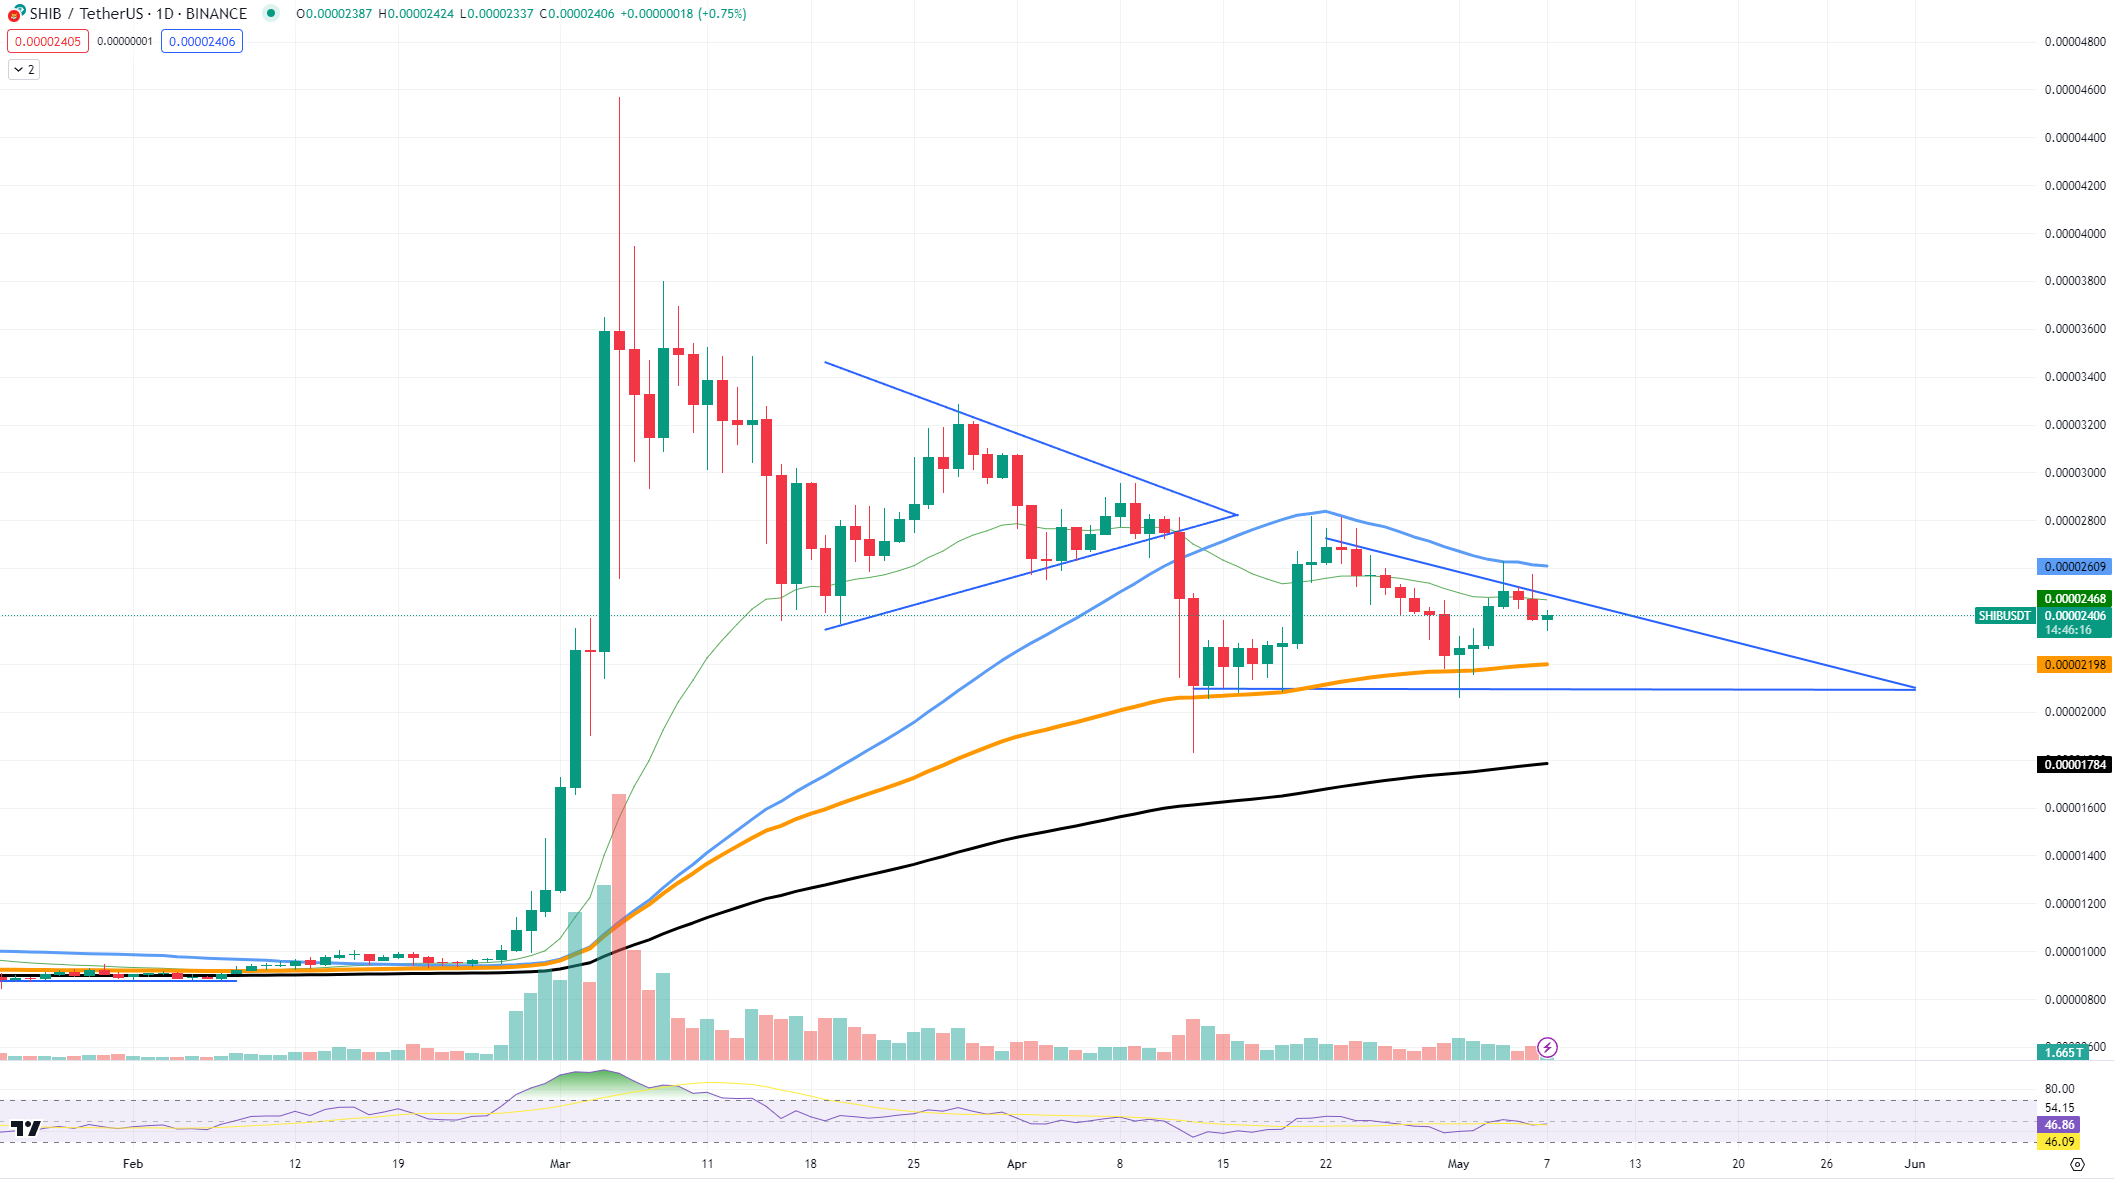
Market sentiment for Shiba Inu appears to be bearish. In this context, falling below $0.000021 could lead to testing the $0.00002 level. The potential for a break below this level could set the stage for an even more significant loss, bringing some trouble for market participants and SHIB in particular.
On the other hand, if SHIB can gain enough buying pressure to reverse the current downtrend, a return to higher resistance levels such as $0.0000268 may be possible. This will require a significant change in market dynamics, potentially driven by positive developments in the Shiba Inu ecosystem or broader market sentiment shifts.
Monitoring volume right now may be the best way to predict an upcoming move for your Shiba Inu. Currently, volume trends are relatively flat, which typically indicates a lack of belief in the market’s direction. An increase in trading volume, especially on upward moves, can be a positive sign that a stronger recovery may be underway, but only if the market in general is turning upward, which unfortunately is not the case for now.
