
Turkish Statistical Institute shared the income distribution statistics of 2023. The highest income group received almost half the share of total income.
Geir Distribution Statistics, Income and Living Conditions Survey 2023 Information regarding the results of the year was taken as reference for the year 2022. In the statement made by TUIK, in the study, household incomes, size and composition were taken into account and converted into equivalent household disposable individual income.
The most important data that stands out in the research is the highest equivalent household disposable income The 20% group that owned it managed to get a 49.8% share of the total income. The group with the lowest income received a share of 5.9% of the total income.
Distribution of annual equivalent household disposable income in sequential 20% groups
| Group | Percentage |
|---|---|
| Top 20% (Lowest) | 5.9% |
| Second 20% | 9.8% |
| Third 20% | 14% |
| Fourth 20% | 20.5% |
| Last 20% (Highest) | 49.8% |
Gini coefficient was 0.433
Gini, one of the measures of income distribution inequality, as 0.433 predicted. The Gini value varies between 0 and 1, and the closer the value is to 1, the greater the income inequality. When calculating Gini, taxes paid in the income reference period and regular transfers to other households or individuals are deducted from the total annual income of the household and individuals.
Income distribution indicators according to equivalent household disposable individual income
| P80/P20 Ratio | 8.4% |
| P90/P10 Ratio | 15% |
| Gini Coefficient | 0.433 |
| Gini Coefficient (excluding social transfers) | 0.520 |
| Gini Coefficient (excluding all social transfer income) | 0.445 |
Other notable points in the study were as follows:
The average annual household disposable income was 167 thousand 983 TL. The annual average equivalent household disposable income was determined as 83 thousand 808 TL. The highest annual average equivalent household disposable income is in single-person households happened. It was followed by households consisting of more than one person without a nuclear family (such as employees with roommates). It was followed by households consisting of a single nuclear family and households consisting of a single nuclear family and other individuals.
The highest share of income came from salaries and wages
income in Turkey 48.5 percent through salaries and wages came. Entrepreneur income came second, followed by social transfer income. Retirement and survivors’ pensions constituted 88.4% of social transfers.
Highest income among higher education graduates
| Educational Status | Income (TL) |
| illiterate | 45,637 |
| Not finishing a school | 63,425 |
| Educated below high school | 89,012 |
| High school and equivalent school | 114,374 |
| High education | 157,851 |
Annual average main business income, directly proportional to the level of education happened. While the job income of higher education graduates was 157 thousand 851 TL, this income was 114 thousand 374 TL for high school and equivalent school graduates, 89 thousand 012 TL for those with less than high school education, 63 thousand 425 TL for those who did not graduate from school, and 45 thousand 637 TL for illiterate individuals.
Income growth is highest in the agricultural sector
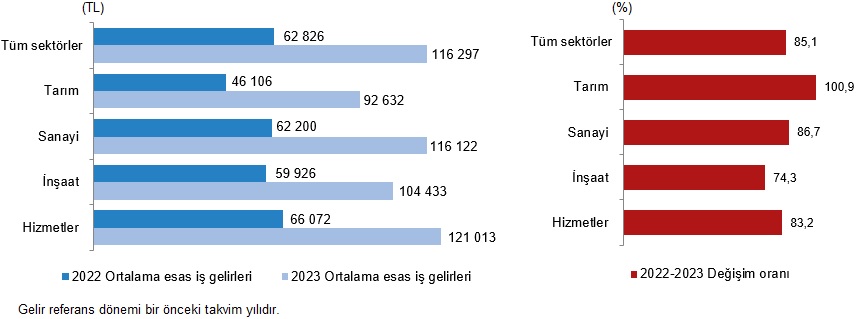
The highest increase in annual average main business income, in the agricultural sector with 100.9% happened. It was followed by industry, construction and service sectors. The lowest income was in the Van, Bitlis, Muş and Hakkari regions, while the highest income was in the Istanbul region. 66.5% of the population was in the same 10 percent group. 42.4% of individuals who were unemployed in the previous year started working last year.
Source :
https://data.tuik.gov.tr/Bulten/Index?p=Gelir-Dagilimi-Istatistikleri-2023-53711&dil=1