
Leading cryptocurrency BitcoinIt dropped to $15,600 after FTX’s sudden bankruptcy in November 2022.
After making a good start to 2023, BTCup nearly 130% from its low at $15,600.
However, continued optimism regarding the approval of the spot Bitcoin ETF helped BTC rise above $38,000. Nautilus ResearchA correction notice came from .
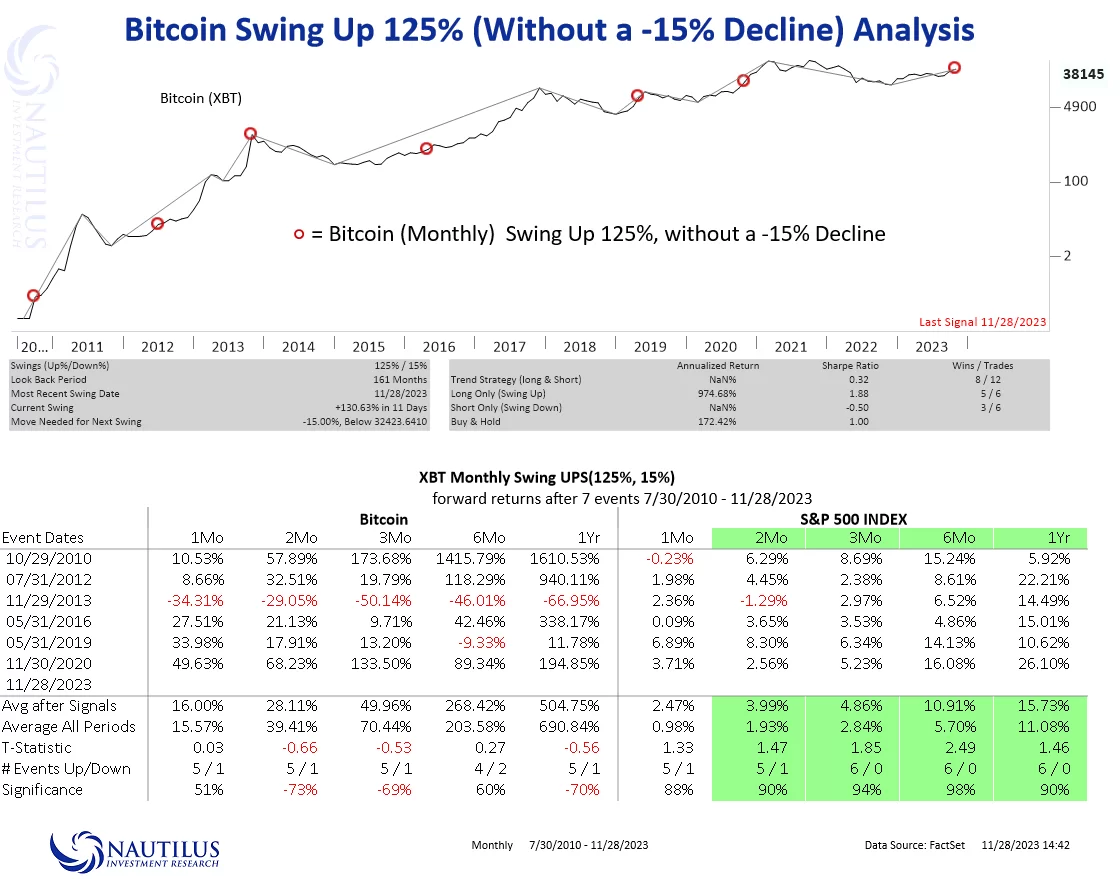
The chart shared by Nautilus Research on the X account signaled that there may be a correction for Bitcoin in the coming days.
The red dots on the chart represent periods when Bitcoin rose 125% on a monthly basis without experiencing a 15% correction.
Accordingly, if Bitcoin experiences a 125% increase without making this correction, this is seen as a correction signal in the short term.
When we look at the previous points, we see that Bitcoin experienced a correction after the red dot was lit, and that sometimes BTC rose a little more and sometimes it fell directly with the signal.
The indicator turned on its signal today, showing that the price must cool down to at least $32,500 before the next bullish wave begins for Bitcoin.
According to the chart, the second leg of the rally may begin in Bitcoin after this cooling.
Even though this indicator gives a correction signal, do not make your investment decisions based on a single data or signal. These indicators are helpful data that have a margin of error and have never been proven to be 100% accurate.
Make your investment decisions based on your own research.
*This is not investment advice.
For exclusive news, analysis and on-chain data Telegram our group, twitter our account and YouTube Follow our channel now! Moreover Android And iOS Start live price monitoring now by downloading our applications!