
Recently, many analysts expressed bullishness in various altcoin projects. In this article, we will provide the latest analysis for 5 popular altcoins. Here are the details…
Solana: Critical resistance levels fall behind
Solana price is actively trying to break through a major hurdle that has been going on for more than a year. A successful break from this level can bring big wins for SOL holders. Also, looking at the dominance of Bitcoin and altcoins, it turns out that capital rotation is overkill, according to analyst Akash Girimath. According to the analyst, Solana price is showing a reverse head & shoulders pattern on the daily time frame. This technical pattern contains three different lows where the middle low is lower than the other two.
A successful rollover of the neckline indicates a breakout for the technical formation that predicts a 71.09 percent increase to $37.21. The target is obtained by adding the distance between the peak of the right shoulder and the point joining the lowest point of the head, as seen in the graph below. So far, Solana price has failed to break through the one-year trendline, but a rally for Solana price is in the cards due to the potential increase in investor confidence in altcoins.
If the SOL hits its theoretical target at $37.21 and the momentum remains relatively strong, it could attempt to rally the buy-stop liquidity standing above the equally high levels formed at $38.92. This move will mean an 80 percent rise. A drop in Solana price below the $18.68 support level will invalidate the bullish argument for SOL. Such a move would tip the odds in favor of the bears, potentially triggering Solana price to drop to $14.95.
20 percent rally expectation for popular altcoin AVAX
Another analyst, Aaryamann Shrivastava, cryptocoin.com As we have also reported, he commented on AVAX, one of the popular altcoin projects. According to the analyst, AVAX price is following broader market clues to go green on the charts preparing for altcoin season. AVAX’s price, trading at $18.07, has been hovering above the critical support (CS) level of $16.00 for over three weeks. The 25 percent rise in March helped the altcoin approach the critical resistance (CR) of $19.17.
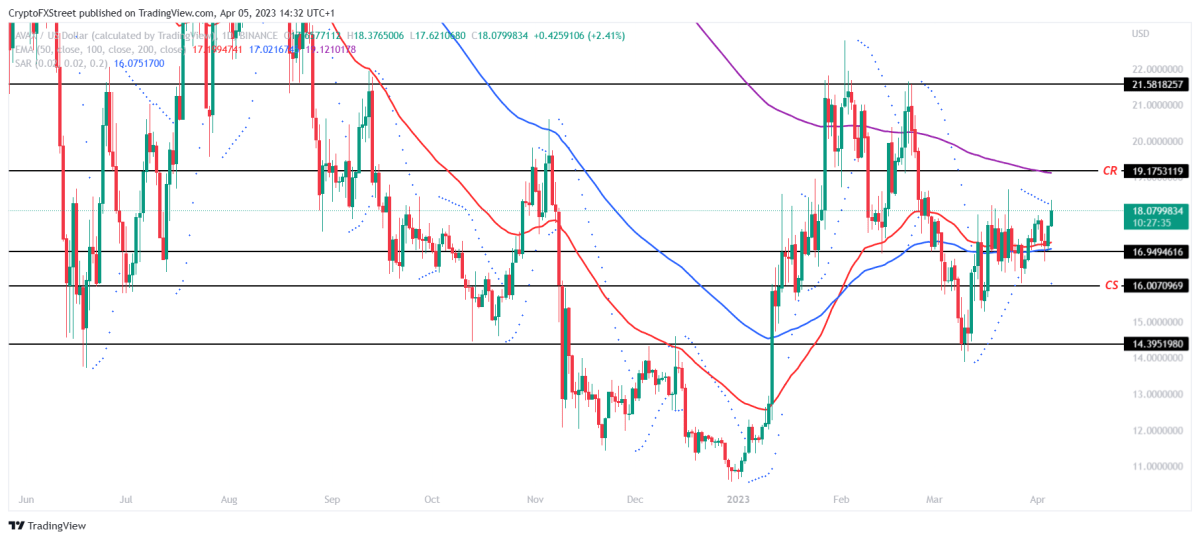
The critical resistance level will need to be translated into a support base at the confluence of the 200-day Exponential Moving Average (EMA). This should help AVAX price continue higher towards $21.58 and rally about 20 percent. Breaking this level will also mark a new year high for the cryptocurrency. The Relative Strength Index (RSI) remains in the bullish zone after turning the neutral line to support. The altcoin is safe from upcoming corrections until the indicator moves into the overbought zone above 70.0.

Also, the MACD continues its bullish crossover from about two weeks ago. As long as the chart points to green candles, the bullish narrative will continue. If the candles turn red or the signal line (red) crosses above the MACD line (blue), the price increase could begin. Therefore, traders will need to watch out for dips below the immediate support level of $16.94 where the 50 and 100-day EMAs converge. The bullish thesis may be invalidated if AVAX price falls further and corrects from the $20.97 high to $14.39 level to CS.
Analyst: Polkadot price moves calmly
On the other hand, according to analyst Filip L., Polkadot (DOT) price is poised to make April a solid month of gains as a gain of around 20 percent is expected by the end of April. The DOT sees the price action being supported and even if the Relative Strength Index (RSI) falls, the trend is still pointing to higher numbers. According to the analyst, it makes sense to expect a nice and stable rally without big waves, which is ideal for traders to make profits at the end of the month. According to the analyst, the DOT could see a gain of about 20% with the February peak as the take profit level.

According to the analyst, the DOT will find support at $6.23 and the 55-day Simple Moving Average (SMA). Both will ensure that the rally is not significantly disrupted. On the upside, monthly resistance at $7.00 will be the first level to reach and pause before entering the final phase. This final phase will extend the price action in the DOT above $7.60, providing a 20 percent gain. On the downside, the analyst points to $5.74.
Altcoin analyst bullish for Aptos
On the other hand, crypto analyst “ali_charts” spotted an interesting pattern on the daily chart of Aptos/USD. He states that Aptos has created a bull flag on its daily chart. The bullish flag formation appears as a downward sloping channel/rectangle depicted by two parallel trendlines running against the prevailing trend. The “bull flag” is a bullish chart pattern formed by two rallies separated by a short consolidation retracement phase. However, Aptos (APT) price may be in the process of starting a larger upward move. However, the decisive thing lies in the 50 and 100 moving averages.
According to Ali, “50 MA and 100 MA can be used to determine whether APT is ready to exit or is tied for a correction.” In this case, a sustained daily close above the moving average or MA 50 would mean bullish. On the other hand, a sustained daily close below the moving average or MA 100 would mean bearish. Aptos fell steadily, dropping to a low of $9.72 on March 10, shortly after hitting an all-time high of $20.39 on January 30, 2023. A recovery was initiated before the bulls hit a barrier just above the daily MA 50 at $14.68. Aptos continues to trade below this key level as its price continues in a sloping channel, thus creating a bullish flag.
What’s next for CVX?
Finally, according to analyst “David”, altcoin Convex Finance (CVX) price is currently turning the previous key resistance level into support. If successful, it could see a rise of more than 50 percent in April. Convex Finance (CVX) price has dropped below the 20-week moving average (MA) since May 2022. During this time, the price reached its yearly low of $3 in June of the same year and started to recover.

The recovery turned into a dead cat bounce when CVX price was rejected by the 20-week MA and once again dropped to the $3 support level in January 2023. Combining this level with the low formed in May 2022, the analyst says he sees a double bottom pattern forming with the bullish divergence on the weekly RSI indicator. This is an uptrend that usually appears at the end of a downtrend.

Indeed, CVX price has risen sharply since then and moved above the 20-week MA with a large bullish candle. After initial rejection, he is currently converting this MA to support. If successful, it could rally to the long-term resistance level of $8.3, an increase of more than 50 percent from the current level. Support is at $4.9.
Contact us to be instantly informed about the last minute developments. twitter‘in, Facebookin and InstagramFollow and Telegram And YouTube join our channel!
Risk Disclosure: The articles and articles on Kriptokoin.com do not constitute investment advice. Bitcoin and cryptocurrencies are high-risk assets, and you should do your own research and due diligence before investing in these currencies. You can lose some or all of your money by investing in Bitcoin and cryptocurrencies. Remember that your transfers and transactions are at your own risk and any losses that may occur are your responsibility. Cryptokoin.com does not recommend buying or selling any cryptocurrencies or digital assets, nor is Kriptokoin.com an investment advisor. For this reason, Kriptokoin.com and the authors of the articles on the site cannot be held responsible for your investment decisions. Readers should do their own research before taking any action regarding the company, assets or services in this article.
Disclaimer: Advertisements on Kriptokoin.com are carried out through third-party advertising channels. In addition, Kriptokoin.com also includes sponsored articles and press releases on its site. For this reason, advertising links directed from Kriptokoin.com are on the site completely independent of Kriptokoin.com’s approval, and visits and pop-ups directed by advertising links are the responsibility of the user. The advertisements on Kriptokoin.com and the pages directed by the links in the sponsored articles do not bind Kriptokoin.com in any way.
Warning: Citing the news content of Kriptokoin.com and quoting by giving a link is subject to the permission of Kriptokoin.com. No content on the site can be copied, reproduced or published on any platform without permission. Legal action will be taken against those who use the code, design, text, graphics and all other content of Kriptokoin.com in violation of intellectual property law and relevant legislation.