
Bitcoin, Ethereum, Dogecoin (DOGE) and most major altcoin projects suffered an unexpected drop on Feb. After the leading crypto hit above $39,000 on Feb. 1, the sharp drop in PayPal’s shares resulted in aggressive selling by short-term investors. In the long run, however, major investors see the decline as a buying opportunity.
Whales continue to accumulate from the bottom price
On-chain data source Whalemap said that whales holding between 100 and 10,000 BTC during the last drop continued to accumulate. Fidelity recently published an article called “Bitcoin First” which highlights that Bitcoin is the most “secure, decentralized form of asset” and is unlikely to be overtaken by any altcoin “as a monetary good”. The report says that Bitcoin combines “the scarcity and durability of gold with the ease of use, storage and portability of fiat money.”
According to a recent NYDIG report, regardless of Bitcoin’s fluctuations, transaction volumes at the end of 2021 have grown by nearly 100% annually over the past five years. This increased Bitcoin’s annual transaction volume to $3 trillion in 2021, surpassing popular credit card network American Express, which recorded $1.3 trillion in payments, and Discover at $0.5 trillion. Could the accumulation of bulls indicate that the bottom is near? Let’s continue with the technical analysis of analyst Rakesh Upadhyay to answer…
BTC, ETH, SOL, XRP and DOGE analysis
Bitcoin’s recovery hit $39,116 on February 1, which acts as a stiff resistance. This suggests that sentiment is downside and traders are selling on rallies to overall resistance levels.

The bears will now try to push the price below $36,632.61. If successful, aggressive bulls who bought the last drop could take profits and push the BTC/USDT pair below $35,000. The downward sloping moving averages and RSI in the negative zone show that the bears are taking advantage. Contrary to this assumption, if the price rises to $36,632.61 it will indicate that the bulls are buying on the dips. Next, they will make another attempt to break through the overhead barrier at $39,600. This is an important level to watch out for because if the pair continues above this level, the next stop could be $43,421. The bulls will have to break through this hurdle to signal a possible end to the downtrend.

Dogecoin (DOGE)
Dogecoin (DOGE) has been stuck between $0.13 and $0.15 for the past few days. Before falling below the support, the price rallied to the 20-day EMA ($0.14), which acts as a stiff resistance.
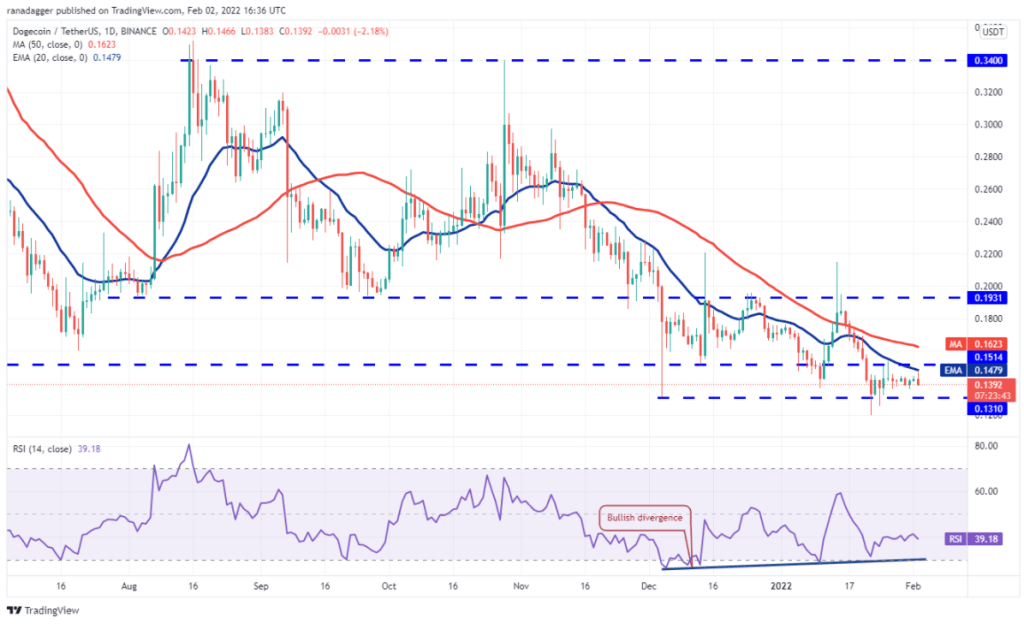
The price has dropped from the 20-day EMA and the bears will again attempt to push and sustain the DOGE/USDT pair below $0.13. The downward sloping moving averages and the RSI in the negative zone indicate that the path of least resistance is to the downside. If the price drops below $0.13 and continues, the next stop for DOGE could be $0.10. Conversely, if the price rises to $0.13, the pair could extend its range-bound action for a few more days. The bulls will have to push and sustain the price above the 50-day SMA ($0.16) to signal a possible change in trend.
Ethereum (ETH)
Ethereum (ETH) closed above the $2,652 breakout level on Jan. 31, but the bulls failed to break the 20-day EMA ($2,792) hurdle. This indicates that the bears are aggressively defending this level.

If the price continues below $2,652, it indicates the bears are back in action. The ETH/USDT pair could then drop to $2,476 and later to the support line of the channel. The downtrend could continue with a break below $2,159. Conversely, if the price bounces back from the current level, it will indicate that the bulls are buying on the dips. Buyers will then try to hold and sustain the pair above the 20-day EMA. If they manage to do so, ETH could start walking towards the resistance line of the channel.
Binance Coin (BNB)
Binance Coin (BNB) recovered from the support line of the channel on Jan. 31, showing the bulls buying on the dips. However, the bulls failed to push the price above $407.

This indicates a lack of demand at higher levels. Both MAs are falling and the RSI is staying in the negative territory, indicating that the bears have prevailed. Sellers will now try to push the price below the support line of the channel. If they are successful, the BNB/USDT pair could drop into the strong support zone between $330 and $320. Alternatively, if the price bounces back from the current level and rises above the 20-day EMA, it will indicate that selling pressure may decrease.
DOGE and ADA bulls prepare for critical support levels
Cardano (ADA) continues to struggle to recover strong support at $1. This points to a lack of urgency among investors to save at current levels. If the bulls fail to push and sustain the price above the moving averages in the next few days, the analyst sees the following scenario as likely: If the ADA price does not rise above the MAs, a break below $1 could become more likely. If this happens, the ADA/USDT pair may resume its downtrend. An initial support on the downside is at $0.80. If this level is broken, the downtrend could extend to the support line of the channel. Conversely, a break and close above the 50-day SMA ($1.25) could result in a retest of the channel’s resistance line.

Left (LEFT)
Solana (SOL) rallied on Jan. 31 and climbed above the $104.82 resistance on Feb. 1. The price reached the 20-day EMA ($112) on Feb. 2, which acted as a strong resistance.

The bears are trying to push the price below $104.82. If they are successful, it will indicate that the bears continue to sell aggressively at higher levels. The SOL/USDT pair could then retest the last low at $80.83. Conversely, if the price bounces back from the current level and rises above $116, it indicates that the bulls are making a comeback. The pair could then attempt a rally to $130 and later to the resistance line of the channel.
Ripple (XRP)
cryptocoin.com As we have included in our analysis, Ripple (XRP) is stuck between $0.54 and $0.65. The bulls’ attempt to start a relief rally failed to even challenge the overhead resistance at $0.65. This shows a lack of faith among the bulls to buy at higher levels. The falling moving averages and the RSI near the oversold zone suggest bears dominate. If the price dips below $0.58, the pair could decline towards the $0.54 strong support. A break and close below this level could push the pair towards psychological support at $0.50. This negative view will be invalidated in the short term if the price rises from the current level and rises above $0.66.

Terra (LUNA) bounced off the support line of the descending channel on January 31, but recorded a candlestick pattern on February 1. This indicates that demand is drying up at higher levels. The uncertainty of the candle formation has been resolved to the downside and the bears will now attempt to push the price towards the strong support at $37.50. The falling 20-day EMA ($61.58) and the RSI in the negative territory suggest bears dominate. If the price rises from the current level and rises above $54.20, it will indicate that the bulls are piling up on the dips. The LUNA/USDT pair could then reach the 20-day EMA, which could act as a resistance. A break and close above this resistance will be the first indication that the bears may lose their grip.

The failure of the bears to pull Polkadot (DOT) below the strong support at $16.81 over the past few days could draw buying from aggressive bulls. This started a relief rally reaching the 20-day EMA ($20.74).

The long wick on the February 2 candlestick shows that the bears are aggressively defending the 20-day EMA. Sellers will make one more attempt to push and sustain the price below the critical support at $16.81. If this happens, the downtrend could continue and the DOT/USDT pair could drop to the next important support at $10.37. Contrary to this assumption, if the price rises from the current level and rises above the 20-day EMA, the pair could rise to the 50-day SMA ($24.63).
Finally, Avalanche’s (AVAX) relief rally stopped near the breakout level at $75.50, indicating that the trend is continuing and the bears are trying to defend their dominance.

If the bears pull the price below $64, the AVAX/USDT pair could gradually slide towards the critical support at $51.04. This level can again act as a strong support and its rebound could result in a range-bound action for a few days. On the other hand, if the price rises from the current level, the bulls will make another attempt to push the price above the overhead resistance at $75.50. If they do, the pair could rally towards the downtrend line of the descending triangle.
Contact us to be instantly informed about the last minute developments. twitter‘in, Facebookin and InstagramFollow and Telegram and YouTube join our channel!

Disclaimer: The articles and articles on Kriptokoin.com do not constitute investment advice. Cryptokoin.com does not recommend buying or selling any cryptocurrencies or digital assets, nor is Kriptokoin.com an investment advisor. For this reason, Kriptokoin.com and the authors of the articles on the site cannot be held responsible for your investment decisions. Readers should do their own research before taking any action regarding the company, asset or service in this article.
Warning: Citing the news content of Kriptokoin.com and quoting by giving a link is subject to the permission of Kriptokoin.com. No content on the site can be copied, reproduced or published on any platform without permission. Legal action will be taken against those who use the code, design, text, graphics and all other content of Kriptokoin.com in violation of intellectual property law and relevant legislation.