
One of the popular meme coins Shiba Inu A slight decrease started next week. Despite the decline, technical indicators show that the potential is higher and the price may rise in the coming weeks.
According to data from CoinMarketCap, the Shiba Inu experienced a small pullback on Monday after recording a rally last week. During this period, SHIB decreased by an average of 3% to $0.00001023. However, the Shiba Inu has managed to maintain a significant portion of the significant gains he has made over the past 30 days.
Most importantly, although the price has fallen slightly today, analysis of key technical indicators shows that the Shiba Inu has enough room to continue its upward trajectory in the short term.
The “relative strength index” or “RSI” metric, which is used to measure the overbought or oversold status of the asset, is currently in a “neutral” zone. This indicates a significant softening from the previous oversold level.
The current RSI indicates that crypto investors are SHIBIt shows that it has not yet pushed into overbought territory, which is not very meaningful. This metric indicates that more positive price action may emerge in the coming days as more room remains for additional gains.
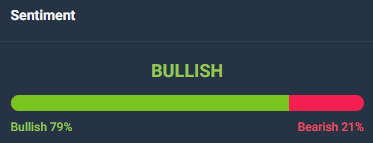
Analysis platform CoinCodex mentioned more bullish signals emerging from the current set of technical indicators following Shiba Inu. While 28 different technical analysis tools gave bullish signals in their evaluations, none of them gave bearish signals.
SHIB, one of the assets that did not participate in the current bull rally in the cryptocurrency market; Solana recorded a low rise of 27%, despite the up to 100% rise of altcoins such as Cardano and Avalanche.
If we recall previous bearish price movements, SHIB remained in the range without breaking the decimal point for about 180 days last year.