
pepe coin The price trajectory is drawing a recurring pattern that can be described as a bearish pennant during the current correction journey. A closer examination of the four-hour chart shows that after a significant decline, the PEPE price often adopts a sideways move, seemingly regaining the declining bearish energy. This trend has been evident in its consolidation over the past week. However, a recent break below the support trend line indicates the potential for further declines.
- bearish formation meme coin threatens the owners with long-term correction.
- The falling coin price may witness demand pressure at $0.0000005.
- The 24-hour trading volume on Pepe coin is $27.2 Million, indicating a loss of 32%.

On September 17, the Pepe coin price showed a decisive decline below the support trend line of the pennant formation. Such a downward push gives bearish traders an additional advantage to exert further downward pressure on the valuation of assets.
Nevertheless, crypto- Broader bullish sentiment echoing across the world has seen the price post a 3.2% gain on the day, pushing the price to face recently breached support, but this time as potential resistance.
At the moment of this analysis, the ‘frog-themed memecoin’ stands at $0.00000064. If it maintains its hold below this recently compromised support, bearish traders can take advantage of this to advance the correction trajectory by approximately 22%, pushing the meme coin towards the $0.0000005 benchmark.
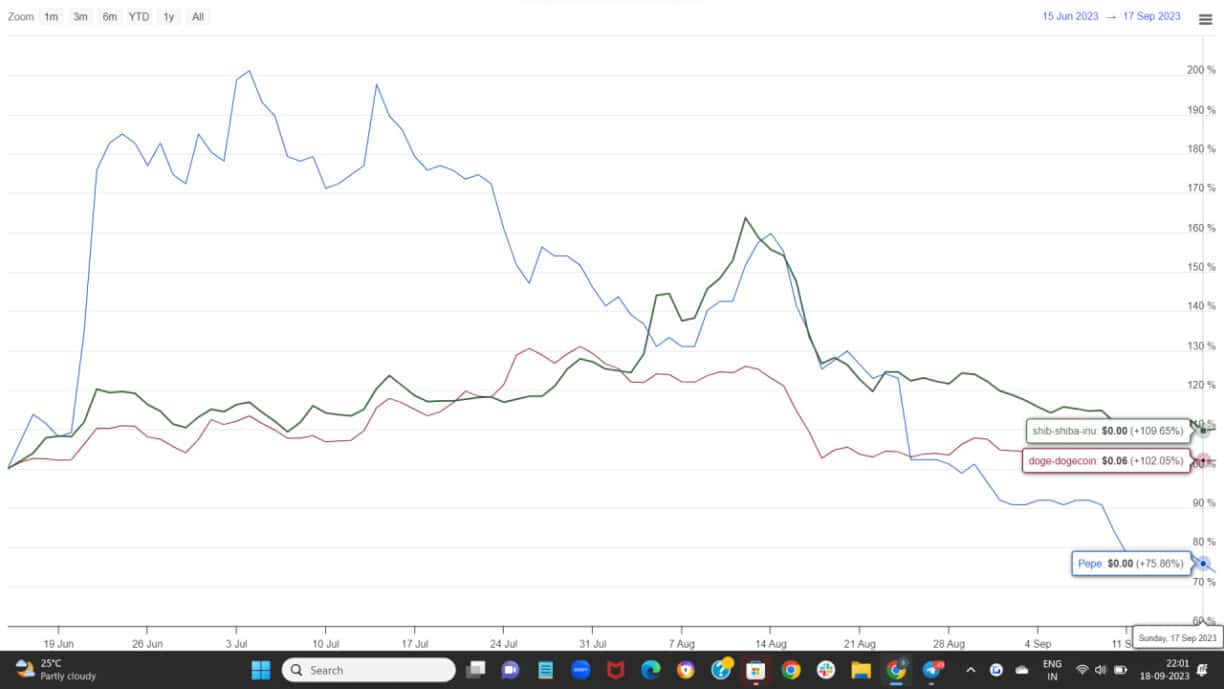
When we delve deeper into the price dynamics of famous meme-based cryptocurrencies in the last quarter, Pepe price volatility becomes striking when compared to the Dog-themed Shiba Inu price and Dogecoin price.
The price chart shows that PEPE has been under a steady downward journey since mid-July and continues to decline with high momentum selling.
In contrast, the price movements of both SHIB and DOGE exhibit relative stability, with both coins trending in a shorter-term sideways phase.