
Having failed to break through the $21,000 resistance over the past week. bitcoinstarted the first week of November with light sales. The leading cryptocurrency continues to trade above the $20,000 psychological limit.
on-chain data collector glassnodeshared some data on Bitcoin’s medium-term outlook with investors. According to a new weekly report by Glassnode, about 15% of Bitcoin supply has changed hands since last July.
Analysts are looking for an answer to the question of where the bottom will be in Bitcoin, based on data from past bear markets.
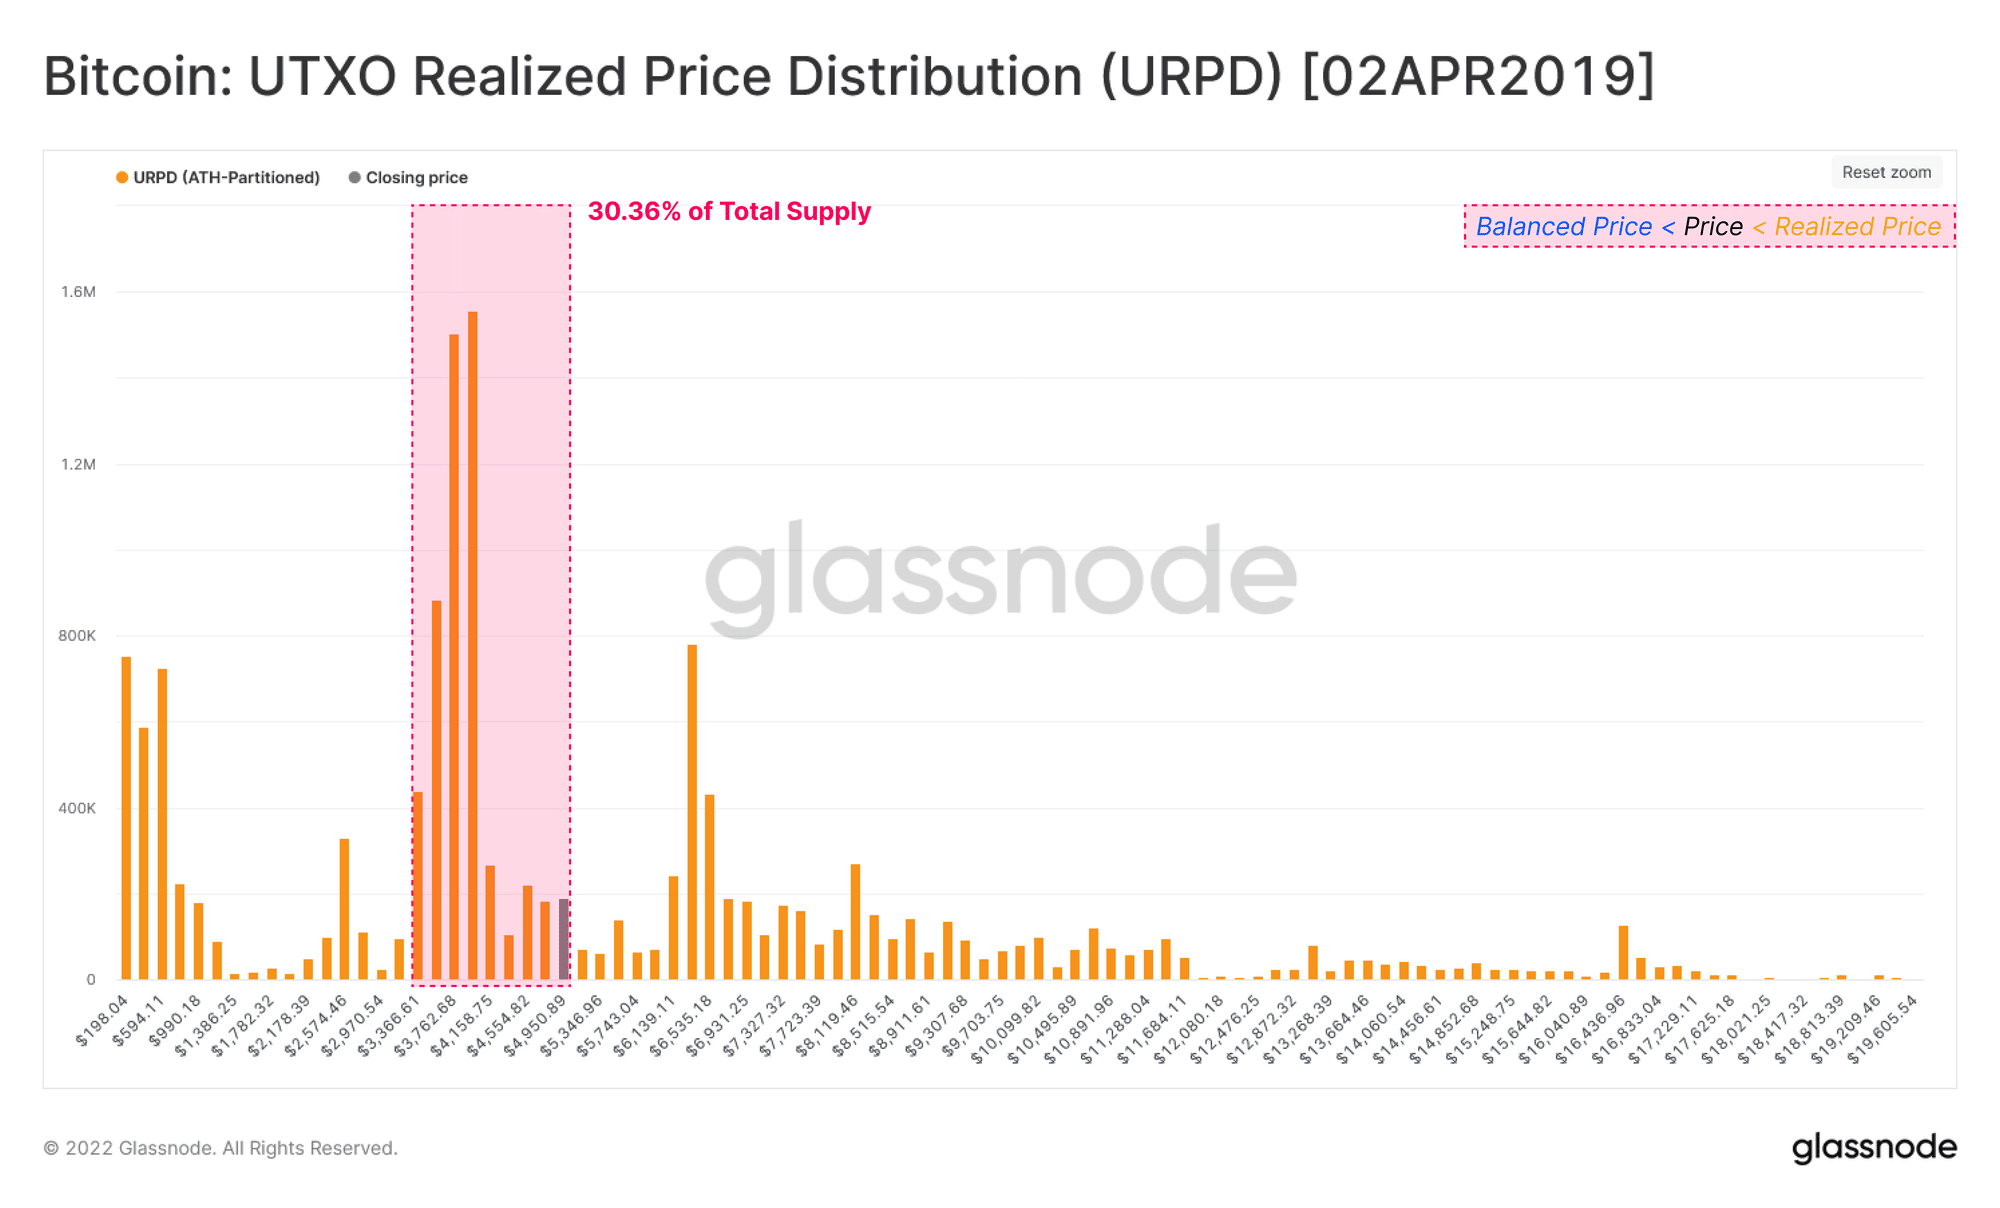
Glassnode has published a series of on-chain data comparing the bear market in 2019 with today. BTC Realized Price (actual price) The metric is just one of the key on-chain data that reveals what levels investors are investing in Bitcoin.
Comparison of 2019 Market and 2022
According to the data, in the bear market in 2019, investors made heavy BTC purchases at points near the bottom. Cryptocurrency purchases rallied around $3,200, the 2019 bear low. BTCs from the bottom made up 30% of the supply.
Today, it has been revealed that there is a similar distribution of purchases to this stop. According to Glassnode, in the bearish market of 2022, the majority of investors bought Bitcoin in the $17-23k range.
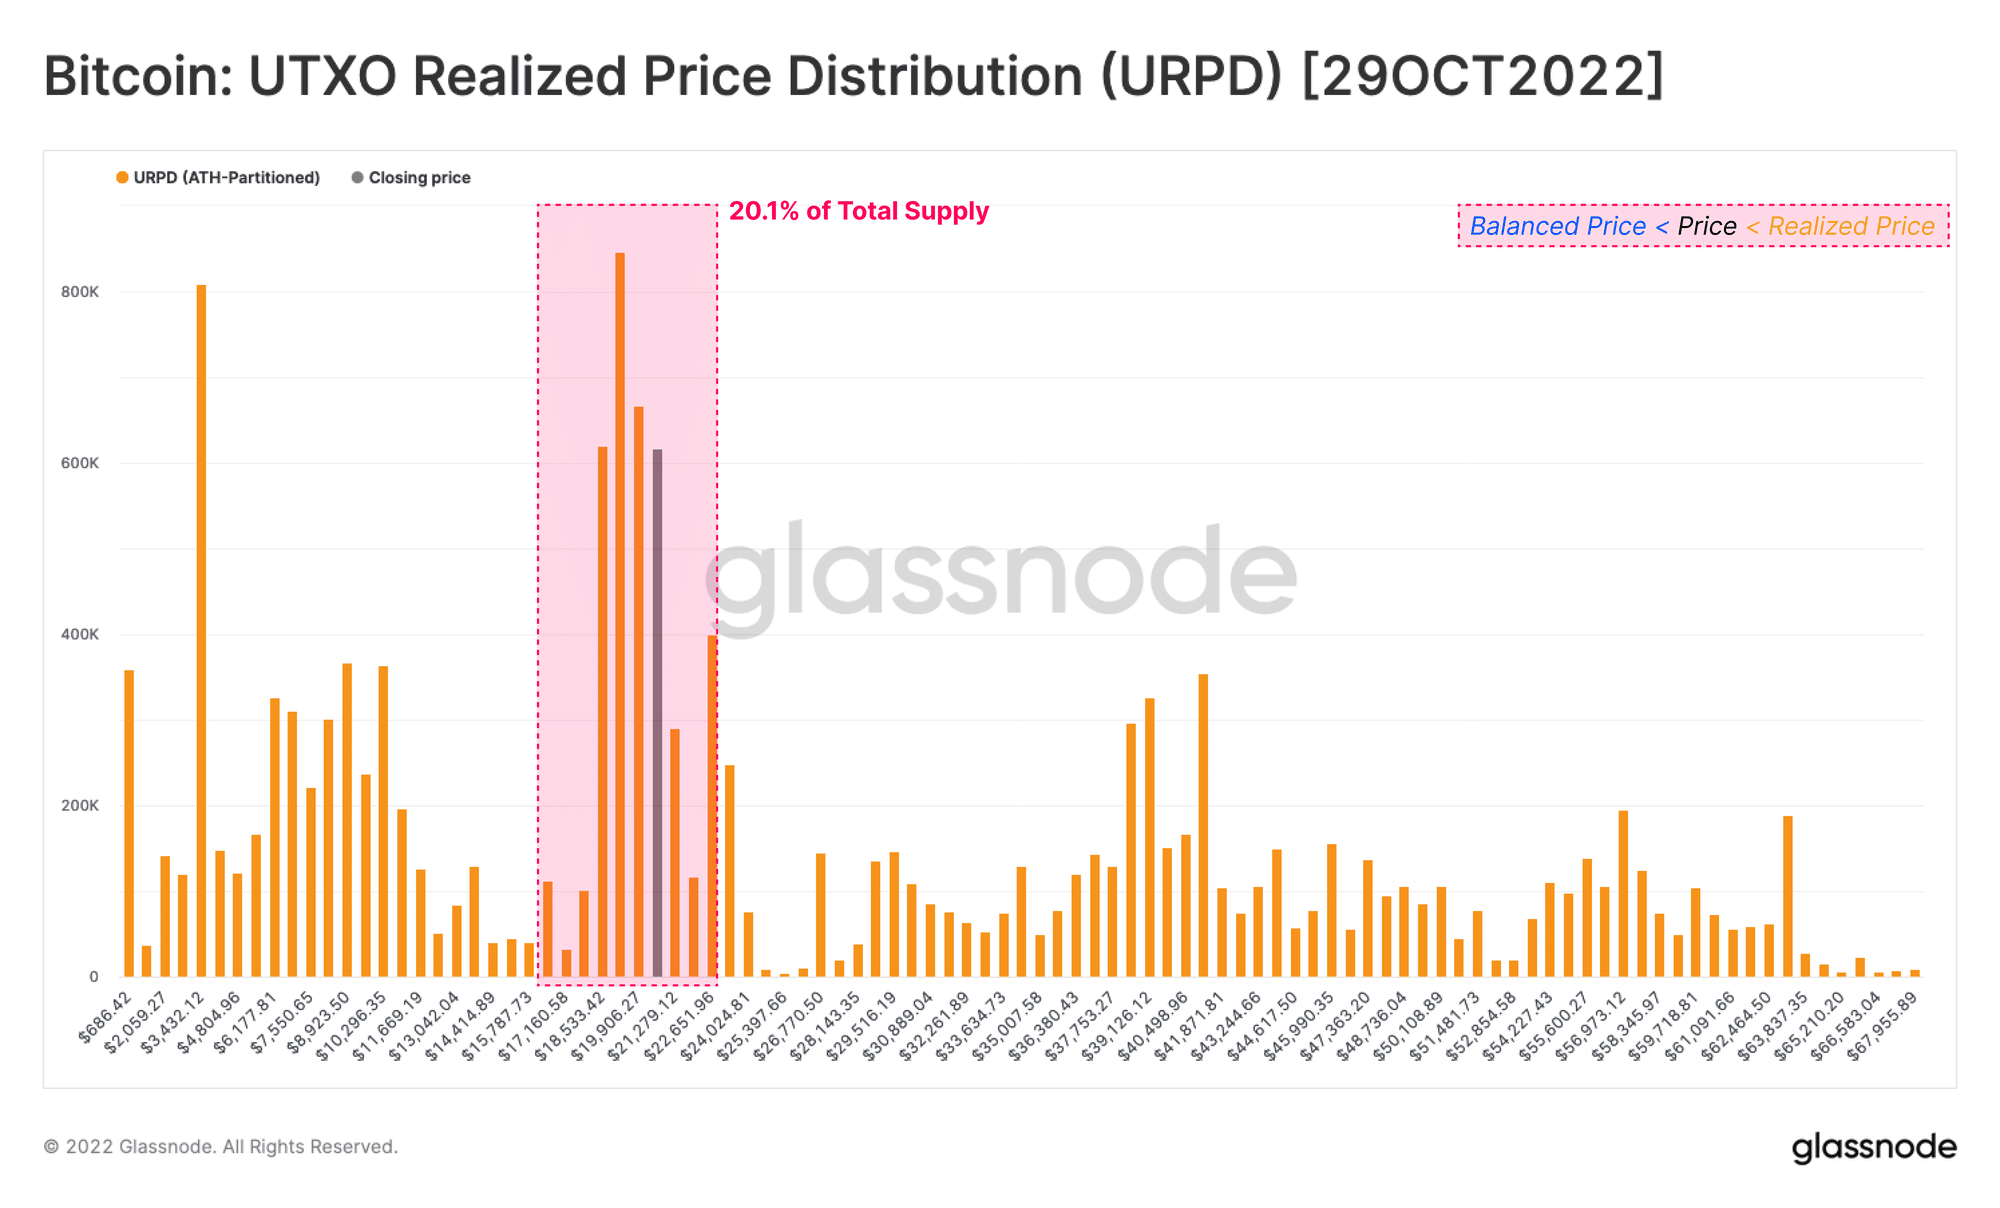
According to analysts, this situation in 2019 may repeat itself. Bitcoin has been trading in the sideways range of $18,000-22,000 since mid-June. Markets await the FED’s decision, which will be announced tomorrow (November 2 at 9:00 pm), and the US Non-Farm Payrolls data, which will be released on the last business day of the week.
*Not investment advice.
For exclusive news, analytics and on-chain data Telegram our group, twitter our account and YouTube Follow our channel now! Moreover Android and iOS Start live price tracking right now by downloading our apps!