
cryptocurrency dogwifhat (WIF) has experienced a significant decline, dropping 12.42% to its current price of $3.85. This decline sharply mirrors the broader crypto market’s 5.85% decline. It indicates underperformance, especially against the background of the general movement of the market. Meme coin also dropped 8.31% against Bitcoin (BTC), highlighting its bearish momentum on the day.
Despite the day’s losses, Dogwifhat has been on an upward trajectory in recent weeks and months. According to data from CoinGecko, it has recorded a significant increase of 200.07% in the last 30 days and a price increase of 2167.87% in the past year. Dogwifhat reached an all-time high of $4.80 on March 31, 2024, highlighting significant growth potential and market interest.
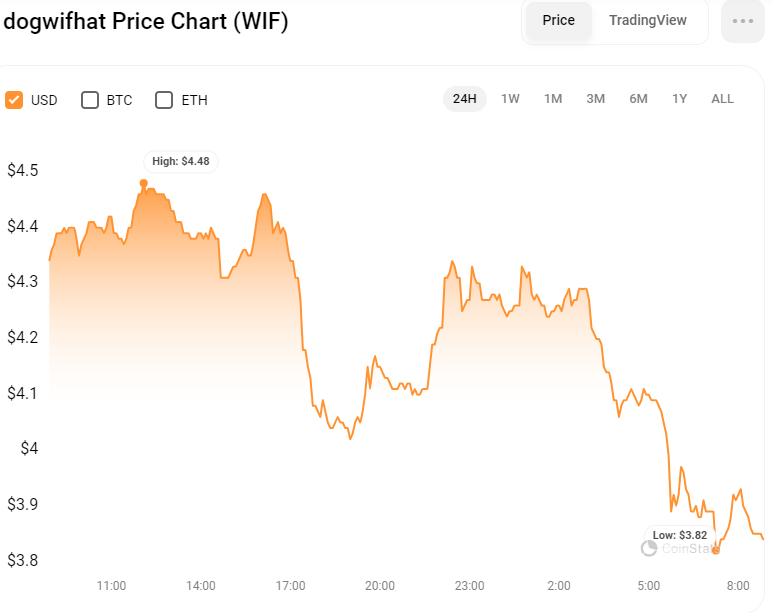
Despite the overall positive sentiment in the market, WIF token has experienced a decline over the last 24 hours. The token, which opened at $4.41, rose to a daily high of $4.48 for a short time. However, as bearish forces came into play, the momentum changed and WIF’s price fell sharply to $3.82. The price has since found some stability, hovering just above $3.85.
This recent decline could deepen if bearish pressure continues, potentially breaking the immediate support level at the intraday low. On the other hand, an uptrend could challenge the day’s top and set it as a potential resistance point. The future movements of the token depend on these critical levels as traders watch closely to see which direction WIF will go next.
WIF/USD Technical Analysis
WIF token has exhibited significant volatility on the 4-hour chart, oscillating between an all-time high of $4.8 and a two-week low of $1.95. After reaching the top, the token entered a bearish phase with its price challenging the 78.6% Fibonacci retracement level.
The market is currently at a critical point; If the price of WIF token closes below this level, it is predicted to move lower towards the 50% Fibonacci level at $3.10, which could serve as a new support zone. Conversely, a close above the 78.6% level could push the token to its all-time high and potentially beyond.
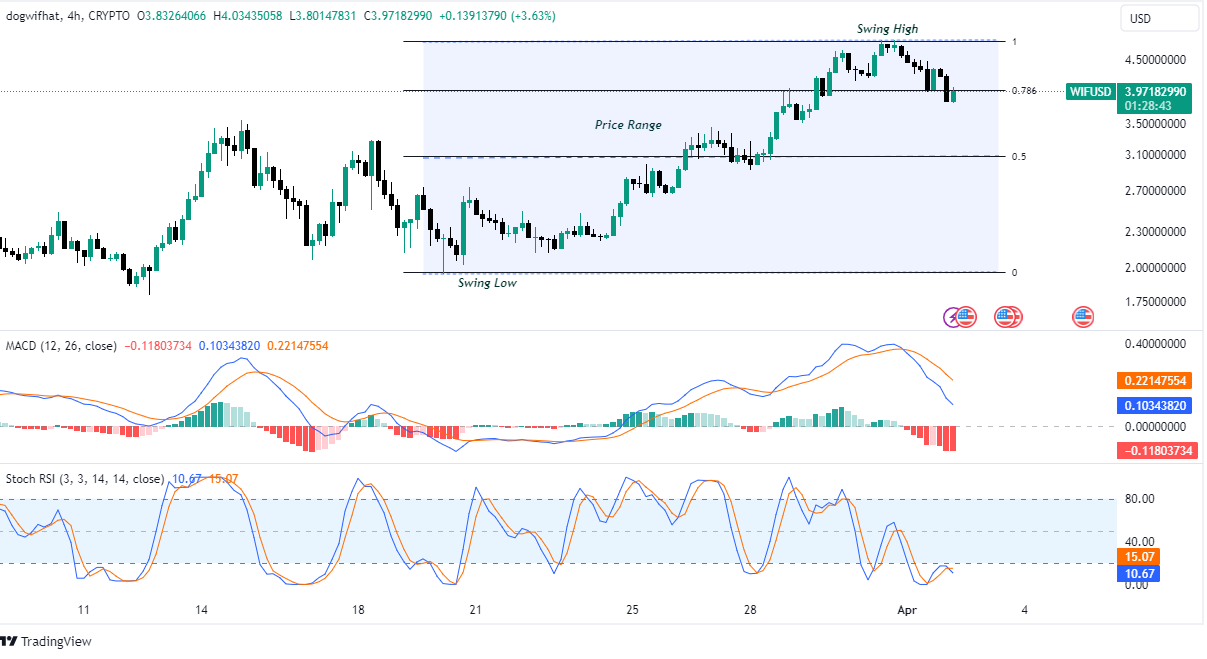
Technical indicators make the bearish momentum even more evident. The Moving Average Convergence Divergence (MACD) indicator is showing a significant downtrend, with the MACD line lying below the signal line at 0.1034, indicating continued downside potential. This is supported by the histogram’s red bars widening below the zero line, reinforcing bearish sentiment.
Similarly, the Stochastic Relative Strength Index (RSI) is below the signal line and in the oversold zone, underlining the bearish trend with a value of 10.67. This positioning suggests that although current sentiment is bearish, there may be room for a potential reversal or bounce back soon.
This type of oversold condition often precedes a change in momentum, making it crucial for investors to carefully observe WIF’s price action for signs of a reversal before making trading decisions.
