
Regression, which is a statistical method used in many different disciplines such as finance and econometrics, especially investment, is used to find the result after the relationship between the variables in a data group. Let’s examine questions such as what is regression, what is regression analysis, how is it done, through examples.
Economics and statistics are detailed sciences that deserve to be considered in detail on their own. These two disciplines are actually not that different because they support each other in some computational methods. Regression is a prime example of this support. in the field of economics variables in a large data pool in your hand. You can find out what will happen as a result of their relationship with each other using the statistical regression method.
Of course, before we start, you will see the basic answers to questions such as what is regression and how to do it, but you need to do a lot more research to learn how to do it exactly because you will appreciate that there are undergraduate programs we will talk about. Come for those who don’t know to have a basic idea about the subject what is regression, what is regression analysis, how is it done Let’s examine the frequently asked questions through examples.
First of all, what is regression?
It has a large data pool in finance, investment, econometrics and similar disciplines. the result of the relationship between more than one independent variable and one dependent variable. The statistical method used to reveal it is called regression. While a so-called linear method is the most commonly used type of regression, there are many different types of regression that are used to build different models.
So what does regression do?
The main purpose of using the regression method is the experience between the variables in a large data pool. detect correlation and, more importantly, to measure whether this correlation is statistically significant. In other words, the answer to the question of whether there is a relationship between the regression and the variables, and if there is, is it useful?
Professional analysts in the world of finance and investment often resort to the regression method. Same way analysts of a company They use the regression method to predict future sales, taking into account previous sales and future conditions, and adding different variables into the business. Regression is also used for transactions such as asset pricing and capital costs.
What is regression analysis, which is part of the regression method?
Regression is a statistical method that reveals the relationship between variables. regression analysis is the accepted tool as part of this method. To put it simply, regression is a general term used for naming this statistical method, while regression analysis is used to apply this method and to name it after it is applied.
The most used regression formulas are:
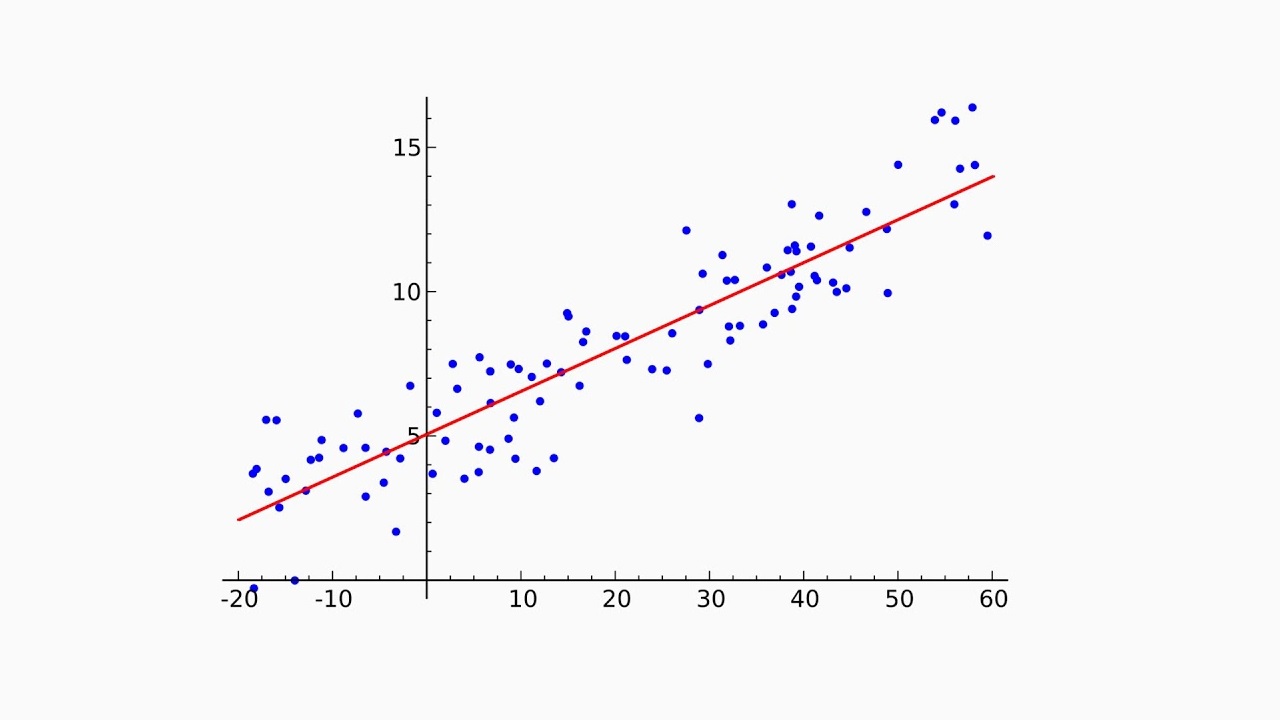
- Linear regression formula: Y = a + bX + u
- Multiple linear regression formula: Y = a + b1X1 + b2X2 + b3X3 + … + btXt + u
We said that there are many more types, but in general, the most used regression types since it is linear and multilinear This is how the most used regression formulas are. The symbols you see in the formula mean the following;
- Y is the dependent variable to be estimated
- X, arguments
- a, equation constant
- b; beta coefficient, equation slope
- u, regression residue
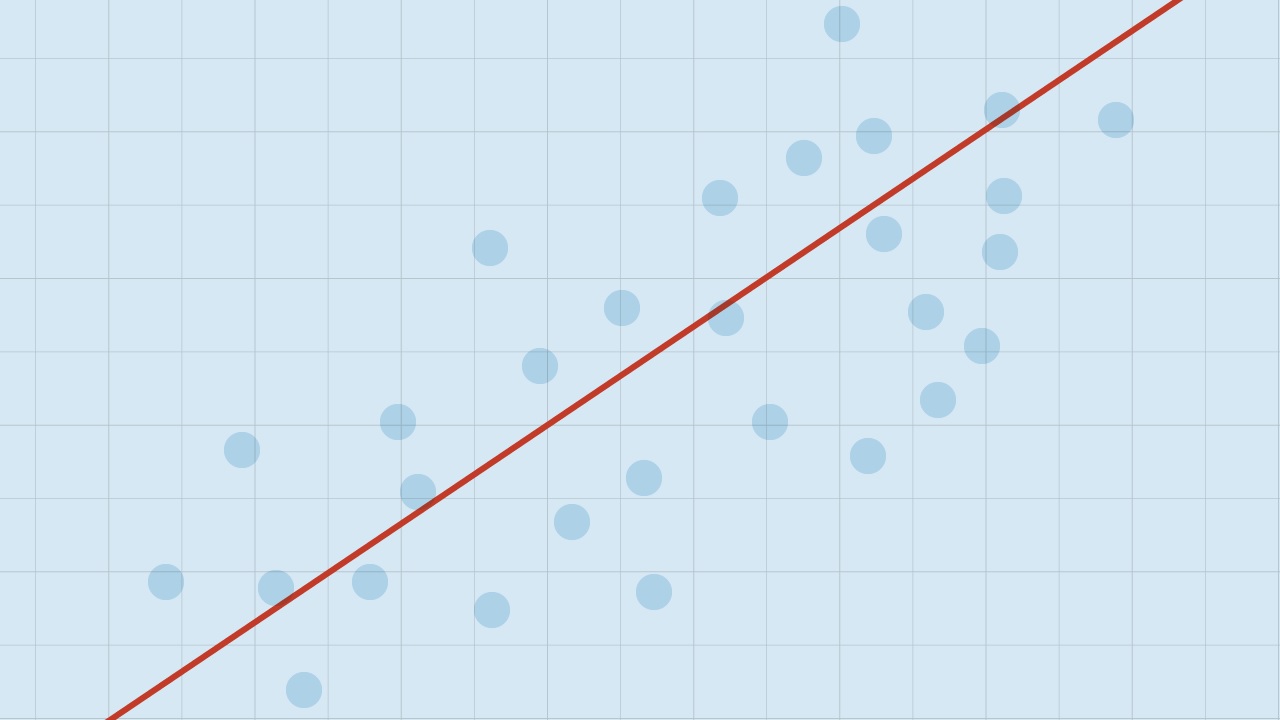
How is regression done? Let’s look at an example:
The regression method is generally based on the price of a good, interest rates and different factors in a particular industry. It is used to see the effects on the price of the good in question. The commodity pricing model is obtained by regression analysis. The returns of a large index are prioritized in order to calculate the returns of a stock and to create the beta coefficient that will determine the returns of this stock.
During the regression analysis, the beta coefficient expresses the risk of the stock in the market and considered as slope in the commodity pricing model. In the regression analysis made to calculate the return of the stock, the return, that is, the dependent variable Y, is included in the equation as the market risk, that is, the independent variable X.
To get a more accurate result, the current market value of the stock, evaluation rates obtained in different analyzes, Additional data such as final returns can also be included in the model. This is how a multiple linear regression model is created with equations to which additional data are added. This model is also called Fama – French.
The relationship between regression and econometrics:
It is used to analyze the data in the repository in the field of finance, investment and economics. A set of statistical techniques is called econometrics. With econometrics, effects such as income effect are examined through observable data. For example, with this technique, it can be predicted that as income increases, expenditure will also increase.
If a relationship is predicted between income and consumption, as in the example, this prediction is to determine how significant regression analysis is done. A few explanatory variables should be added when performing the regression analysis. By adding these variables, a multiple linear regression model is created, which is the most widely used tool in econometrics.
Econometrics is sometimes criticized because of the results of regression analysis. without making contact with an economic theory or rely on causal mechanisms without making a connection. Of course, this criticism can sometimes be justified, but it is extremely important that even the simple data obtained as a result of the analysis are explanatory without a special theory.
Let’s look briefly at the types of regressions:
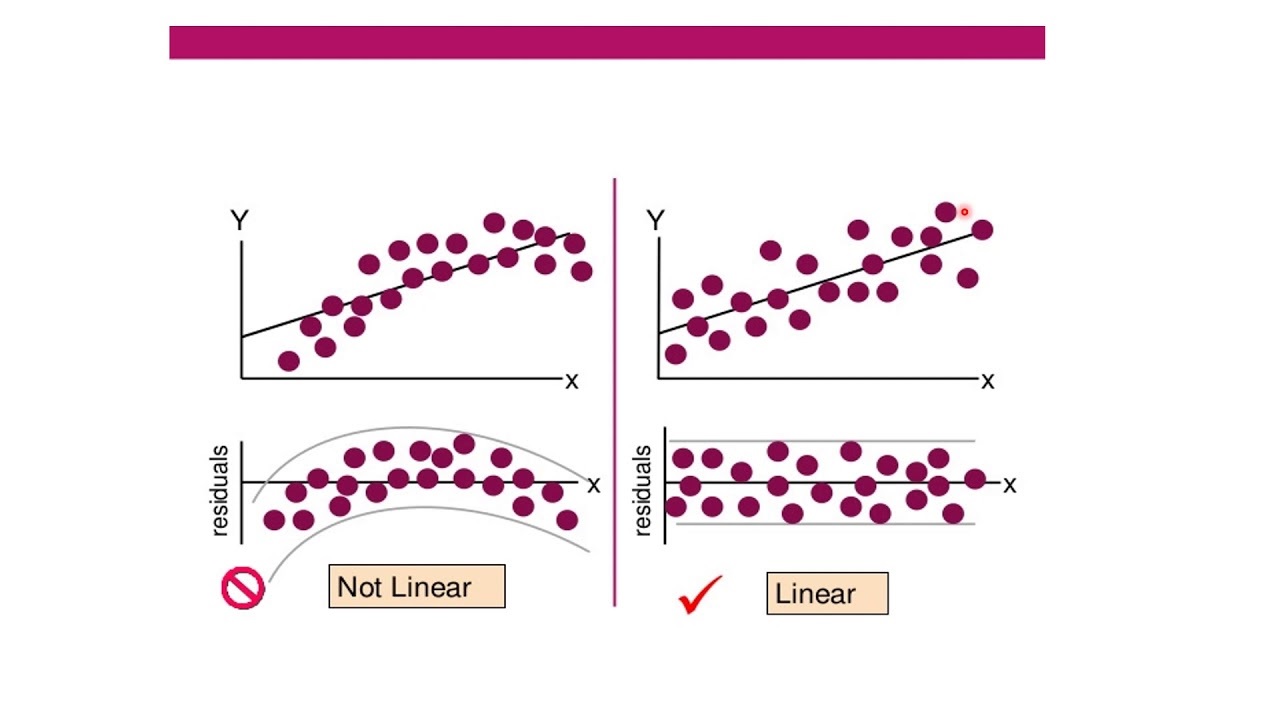
- Linear regression is a model that consists of all linear variables.
- Stepwise linear regression is a model in which more than one independent variable is used.
- Polynomial regression models variables nonlinearly.
- Logistic regression is a model used in the field of biology.
- Ridge regression analyzes data obtained in multiple regression.
- Lasso regression is the model for which continuous information is not typical.
- Quantile regression is a technique used when the necessary conditions for linear regression are not met.
- Elastic net regression is used when there is too much correlated independent variable.
- Ordinal regression is a technique that predicts ordinal values.
Some of the assumptions used in regression models are:
- The relationship between all variables is linear.
- The variable and the regression residual should remain constant.
- All explanatory variables in the equation are independent of each other.
- All variables in the equation are normally distributed.
Statistical method used in fields such as finance, investment and economics what is regression, what is regression analysis We talked about important points you need to know about the subject by answering frequently asked questions. Regression, of course, is a much more detailed subject, but in this article, we only aimed to provide readers with a basic knowledge of the subject.