
Leading cryptocurrency analysts have announced the trading levels for DOGE, SOL, MATIC and these 5 altcoins! Here are the details…
The critical trading levels for DOGE, SOL, MATIC and these 5 altcoin projects have been announced!
Bitcoin has been trading in a narrow range for the past few days. Generally, narrow gaps are followed by a range expansion and result in strong trend moves. On-chain analytics platform Glassnode tweeted on May 22 that Bitcoin’s seven-day price range is “comparable to January 2023 and July 2020, both preceded by major market moves.” Not only Bitcoin, but even the S&P 500 Index (SPX) is at a critical point. After gaining 1.65% last week, SPX has come close to stiff resistance. Market participants will be watching the outcome of debt ceiling negotiations with interest before attempting to initiate a trend move.
However, according to experts, another trigger may be macroeconomic data, as these data will give an idea about possible steps to be taken by the US Federal Reserve at its next meeting on 13 and 14 June. The FedWatch Tool currently predicts a 72% probability of a pause by the Fed. So, what about altcoins? Here are the details…
S&P 500 Index
The bulls pushed SPX above the 4,200 resistance on May 19 but were unable to sustain higher. This shows that the bears are vigorously maintaining this level.

However, the 20-day exponential moving average (EMA) at 4.140 is gradually sloping up and the relative strength index (RSI) is in positive territory, suggesting that the bulls are in control. They will probably make another attempt to break through the barrier at 4,200. If they succeed, they will have completed the ascending triangle pattern. The index may rise to 4,300 and then to 4,600. Moving averages are important support levels to watch out for on the downside. A break below the 50-day simple moving average (SMA) at 4,080 will be the first indication that the bulls may be in a rush to exit. This could push the price towards the uptrend line.
US Dollar Index
The US Dollar Index (DXY) has been hovering between 100.82 and 106 for the past few days. According to experts, traders usually buy near support and sell near resistance.
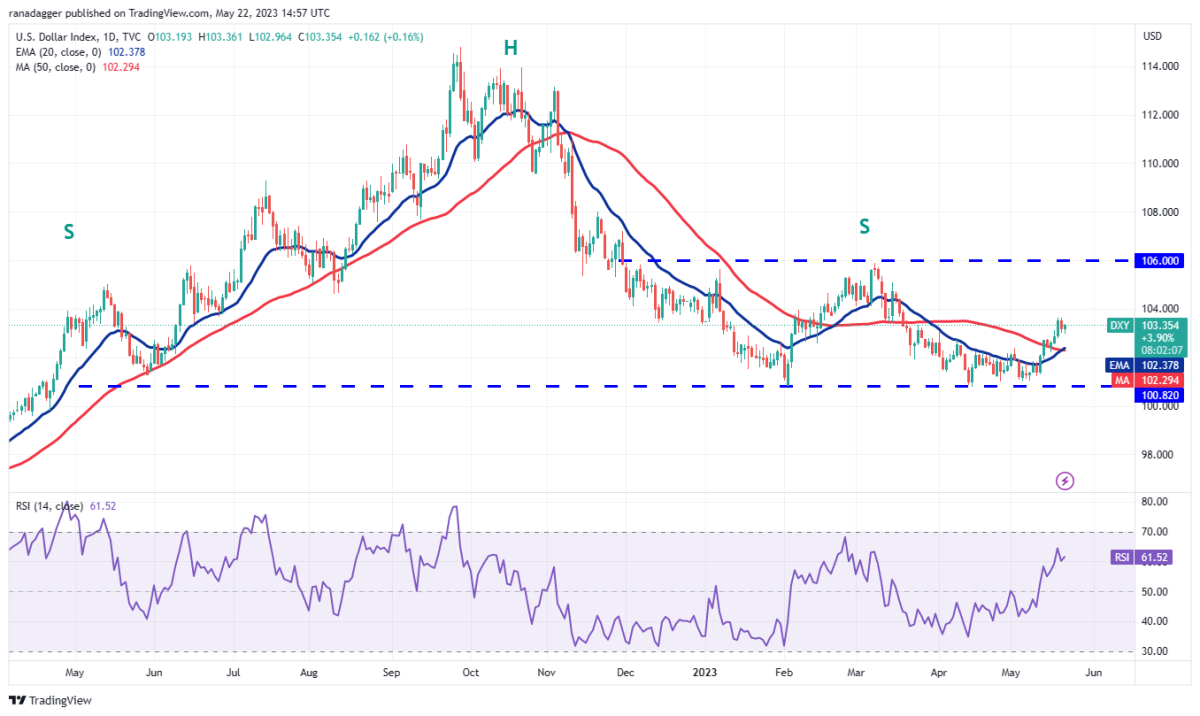
The repeated failure of bears to push the price below 100.82 may have prompted aggressive bulls to buy. The bulls pushed the price above the moving averages on May 12, paving the way for a potential rise towards 106. This level can act as a tough resistance and the bulls may have a hard time surmounting it. On the downside, breaking below the moving averages will be the first indication that the bears are selling on small rallies. This may cause a retest of the important level at 100.82.
Bitcoin (BTC) price analysis
For Bitcoin, the bears successfully defended the 20-day EMA ($27,414) but were unable to bring the price down to the crucial support at $25,250. This shows that the bulls are buying on small dips.

As long as the price for BTC stays above the $26,361 close support, the bulls will continue their efforts to push the price back into the symmetrical triangle formation. If they do, it will indicate that the markets are rejecting the lower levels. This could increase the probability of a rally towards the resistance line. This level can again be a major hurdle for the bulls. Contrary to this assumption, if the price drops and dips below $26.361, it will indicate that supply has exceeded demand. The BTC/USDT pair can then fall to the critical level of $25,250.
Ethereum (ETH) price analysis
Ethereum (ETH) has been trading close to the 20-day EMA ($1,833) for the past few days. Even though the bears successfully defended the level, the bulls continued the pressure. This increases the probability of a break above the 20-day EMA.

If this happens, the ETH/USDT pair could rise to the resistance line of the falling wedge formation. This level could act as a strong barrier again, but if the bulls overcome it, the pair could start a rise towards $2,000 and then $2,141. Conversely, if the price declines and breaks below $1,771, the pair could drop to the support line. This is an important level for the bulls to defend, as breaking below it will likely result in a drop to $1,600.
Binance Coin (BNB) price analysis
Binance Coin (BNB) has been trading between the 20-day EMA ($313) and the horizontal support at $300 for the past few days.

The falling 20-day EMA and RSI near 44 suggest that the bears have a slight advantage. Sellers will try to push the price below $300 and challenge the support line of the descending channel formation. Conversely, if the price turns up from the current level and rises above the moving averages, it will indicate that the bulls are attempting a reversal. The BNB/USDT pair could then rise to the resistance line of the channel.
Ripple (XRP) price analysis
The bulls failed to push XRP above the downtrend line, but holding the 20-day EMA ($0.45) support to the downside is a minor positive. This indicates that sentiment is bullish and bears are buying.
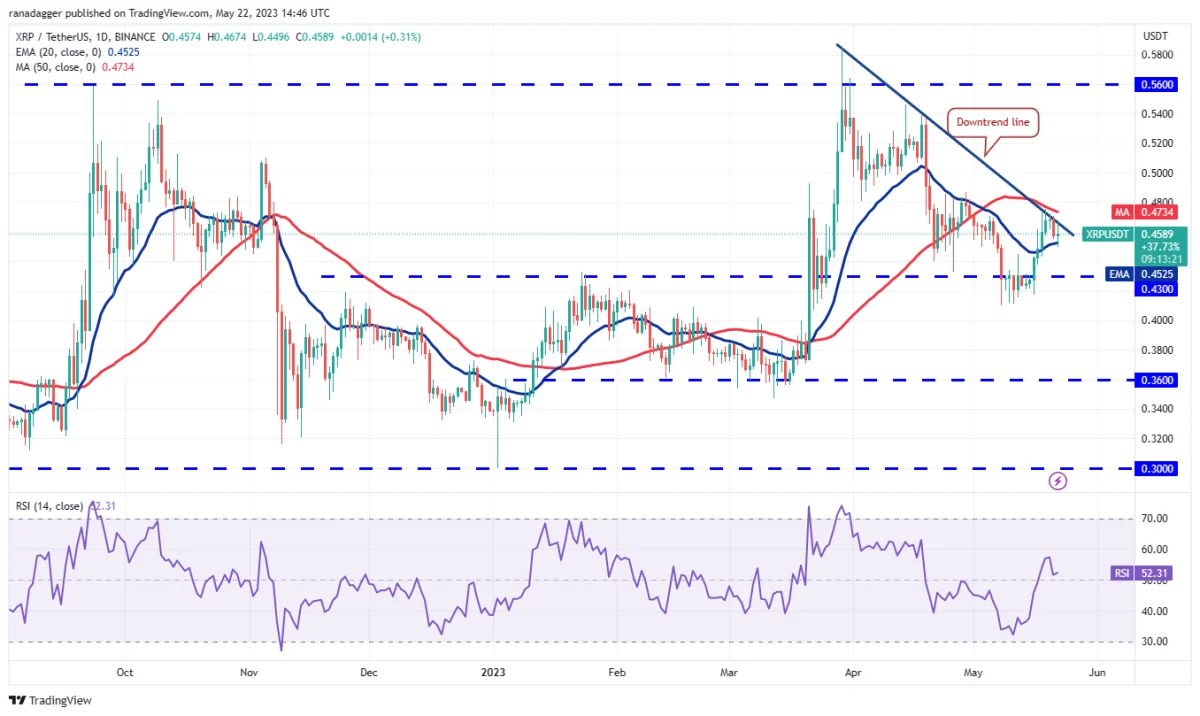
The 20-day EMA has gradually started to rise and the RSI is in the positive zone, indicating that the path of least resistance is to the upside. If buyers push the price above the 50-day SMA ($0.47), the XRP/USDT pair could gain momentum and rise towards $0.54. This positive view will be invalidated in the near term should the price decline and break below the 20-day EMA. This could open the way for a decline to the critical support zone of $0.43 to $0.40.
Cardano (ADA) price analysis
Cardano continued its decline in the last three days and reached the uptrend line on May 21. This is an important level to watch as a break below this level will indicate that the bulls are out of control.

The solid bounce from the uptrend line on May 22 shows that the buyers continue to protect this level with all their might. If the bulls push the ADA price above the 20-day EMA ($0.37), this will indicate that the selling pressure has subsided. The ADA/USDT pair is likely to gain momentum above the 50-day SMA ($0.39). Instead, if the price drops from the 20-day EMA once again and breaks below the uptrend line, it will indicate the start of a deeper correction to $0.30.
Dogecoin (DOGE) price analysis
Dogecoin (DOGE) turned down from the 20-day EMA ($0.07) on May 21, but the bulls continue to buy lows to $0.07, suggesting that the price is stuck in the range.
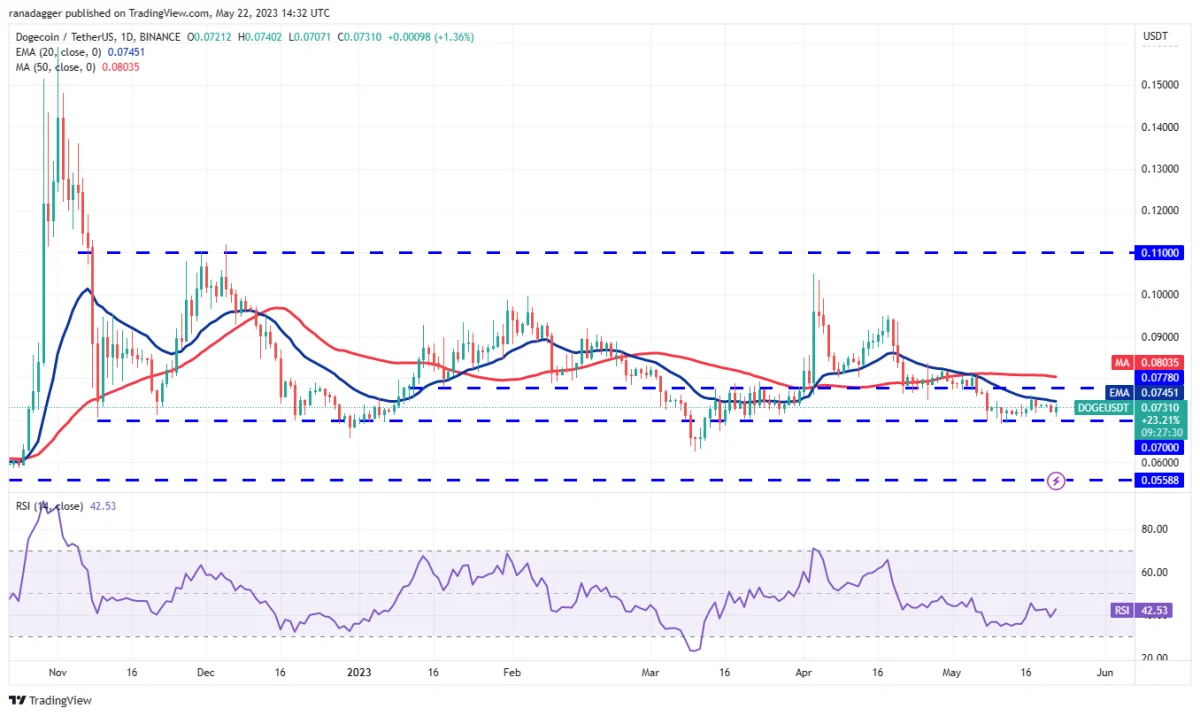
The bears will try to strengthen their positions by pulling DOGE price below the solid $0.07 support. If they manage to do so, the DOGE/USDT pair could drop as low as $0.06 and buyers will try to stop the decline again. On the contrary, if the bulls push the price above the 20-day EMA, it will indicate that the range has been resolved in favor of the buyers. The pair could first reach the 50-day SMA ($0.08) and then attempt a rise to $0.10.
Solana (SOL) price analysis
Solana (SOL) turned bearish on May 21, breaking below the strong support at $19.85, signaling that bears continue to dominate.
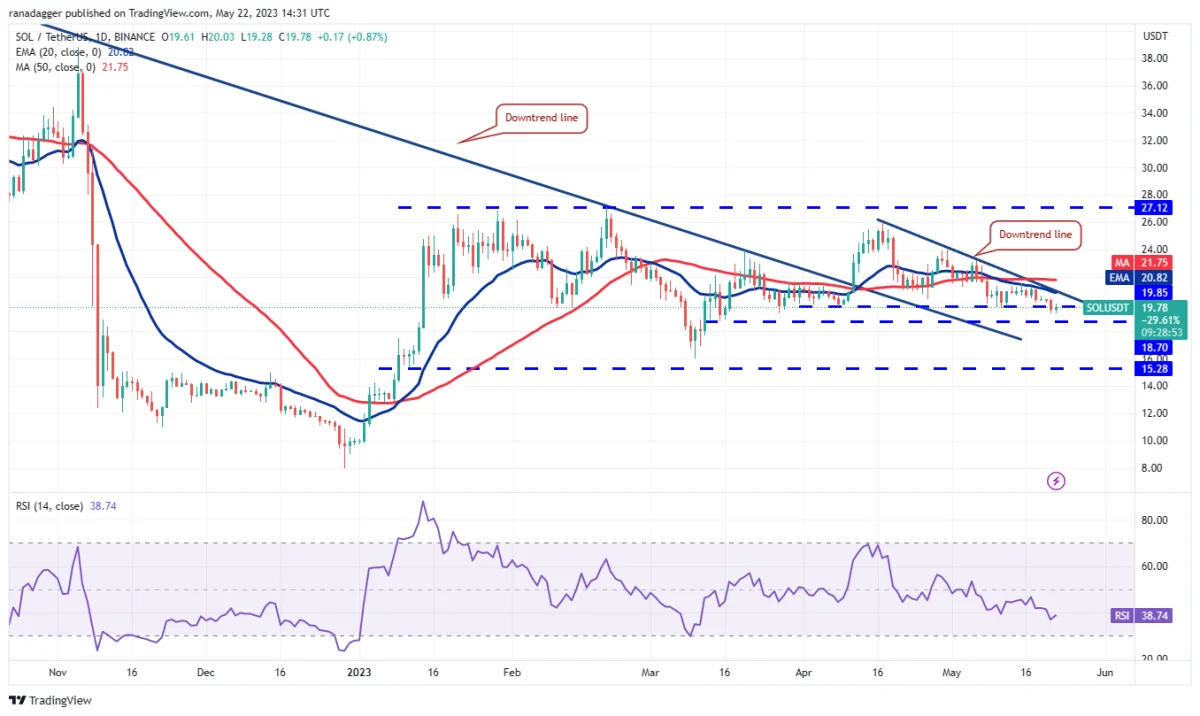
The SOL/USDT pair could decline to $18.70, which is an important level to consider because if this level is broken, the pair could drop to the critical support of $15.28. This level is likely to attract strong buys by the bulls. On the upside, a rally above the moving averages will indicate that selling pressure has subsided. This would open the doors for a potential rally to $24 and then to $27.12. Sellers will try to stop the recovery at this level.
Polygon (MATIC) price analysis
Polygon (MATIC) has been swinging in a tight range between $0.91 and $0.82 for the past few days. This indicates that investors are unsure about the next directional move.

The downward sloping moving averages and the RSI below 39 suggest that the bears are in command. Sellers will try to push the price below $0.82 and continue the downtrend. The MATIC/USDT pair could retest vital support at $0.69 later. Buyers are expected to defend this level aggressively. If the bulls want to start a recovery, they will need to push the price above the $0.91 to $0.94 resistance zone. The pair could then start a strong relief rally towards the resistance line.
Contact us to be instantly informed about the last minute developments. twitter‘in, Facebookin and InstagramFollow and Telegram And YouTube join our channel!
Risk Disclosure: The articles and articles on Kriptokoin.com do not constitute investment advice. Bitcoin and cryptocurrencies are high-risk assets, and you should do your due diligence and do your own research before investing in these currencies. You can lose some or all of your money by investing in Bitcoin and cryptocurrencies. Remember that your transfers and transactions are at your own risk and any losses that may occur are your responsibility. Cryptokoin.com does not recommend buying or selling any cryptocurrencies or digital assets, nor is Kriptokoin.com an investment advisor. For this reason, Kriptokoin.com and the authors of the articles on the site cannot be held responsible for your investment decisions. Readers should do their own research before taking any action regarding the company, assets or services in this article.
Disclaimer: Advertisements on Kriptokoin.com are carried out through third-party advertising channels. In addition, Kriptokoin.com also includes sponsored articles and press releases on its site. For this reason, advertising links directed from Kriptokoin.com are on the site completely independent of Kriptokoin.com’s approval, and visits and pop-ups directed by advertising links are the responsibility of the user. The advertisements on Kriptokoin.com and the pages directed by the links in the sponsored articles do not bind Kriptokoin.com in any way.
Warning: Citing the news content of Kriptokoin.com and quoting by giving a link is subject to the permission of Kriptokoin.com. No content on the site can be copied, reproduced or published on any platform without permission. Legal action will be taken against those who use the code, design, text, graphics and all other content of Kriptokoin.com in violation of intellectual property law and relevant legislation.